Market Note · 23 September 2026
Small Business Share of Federal Prime Dollars, FY2026
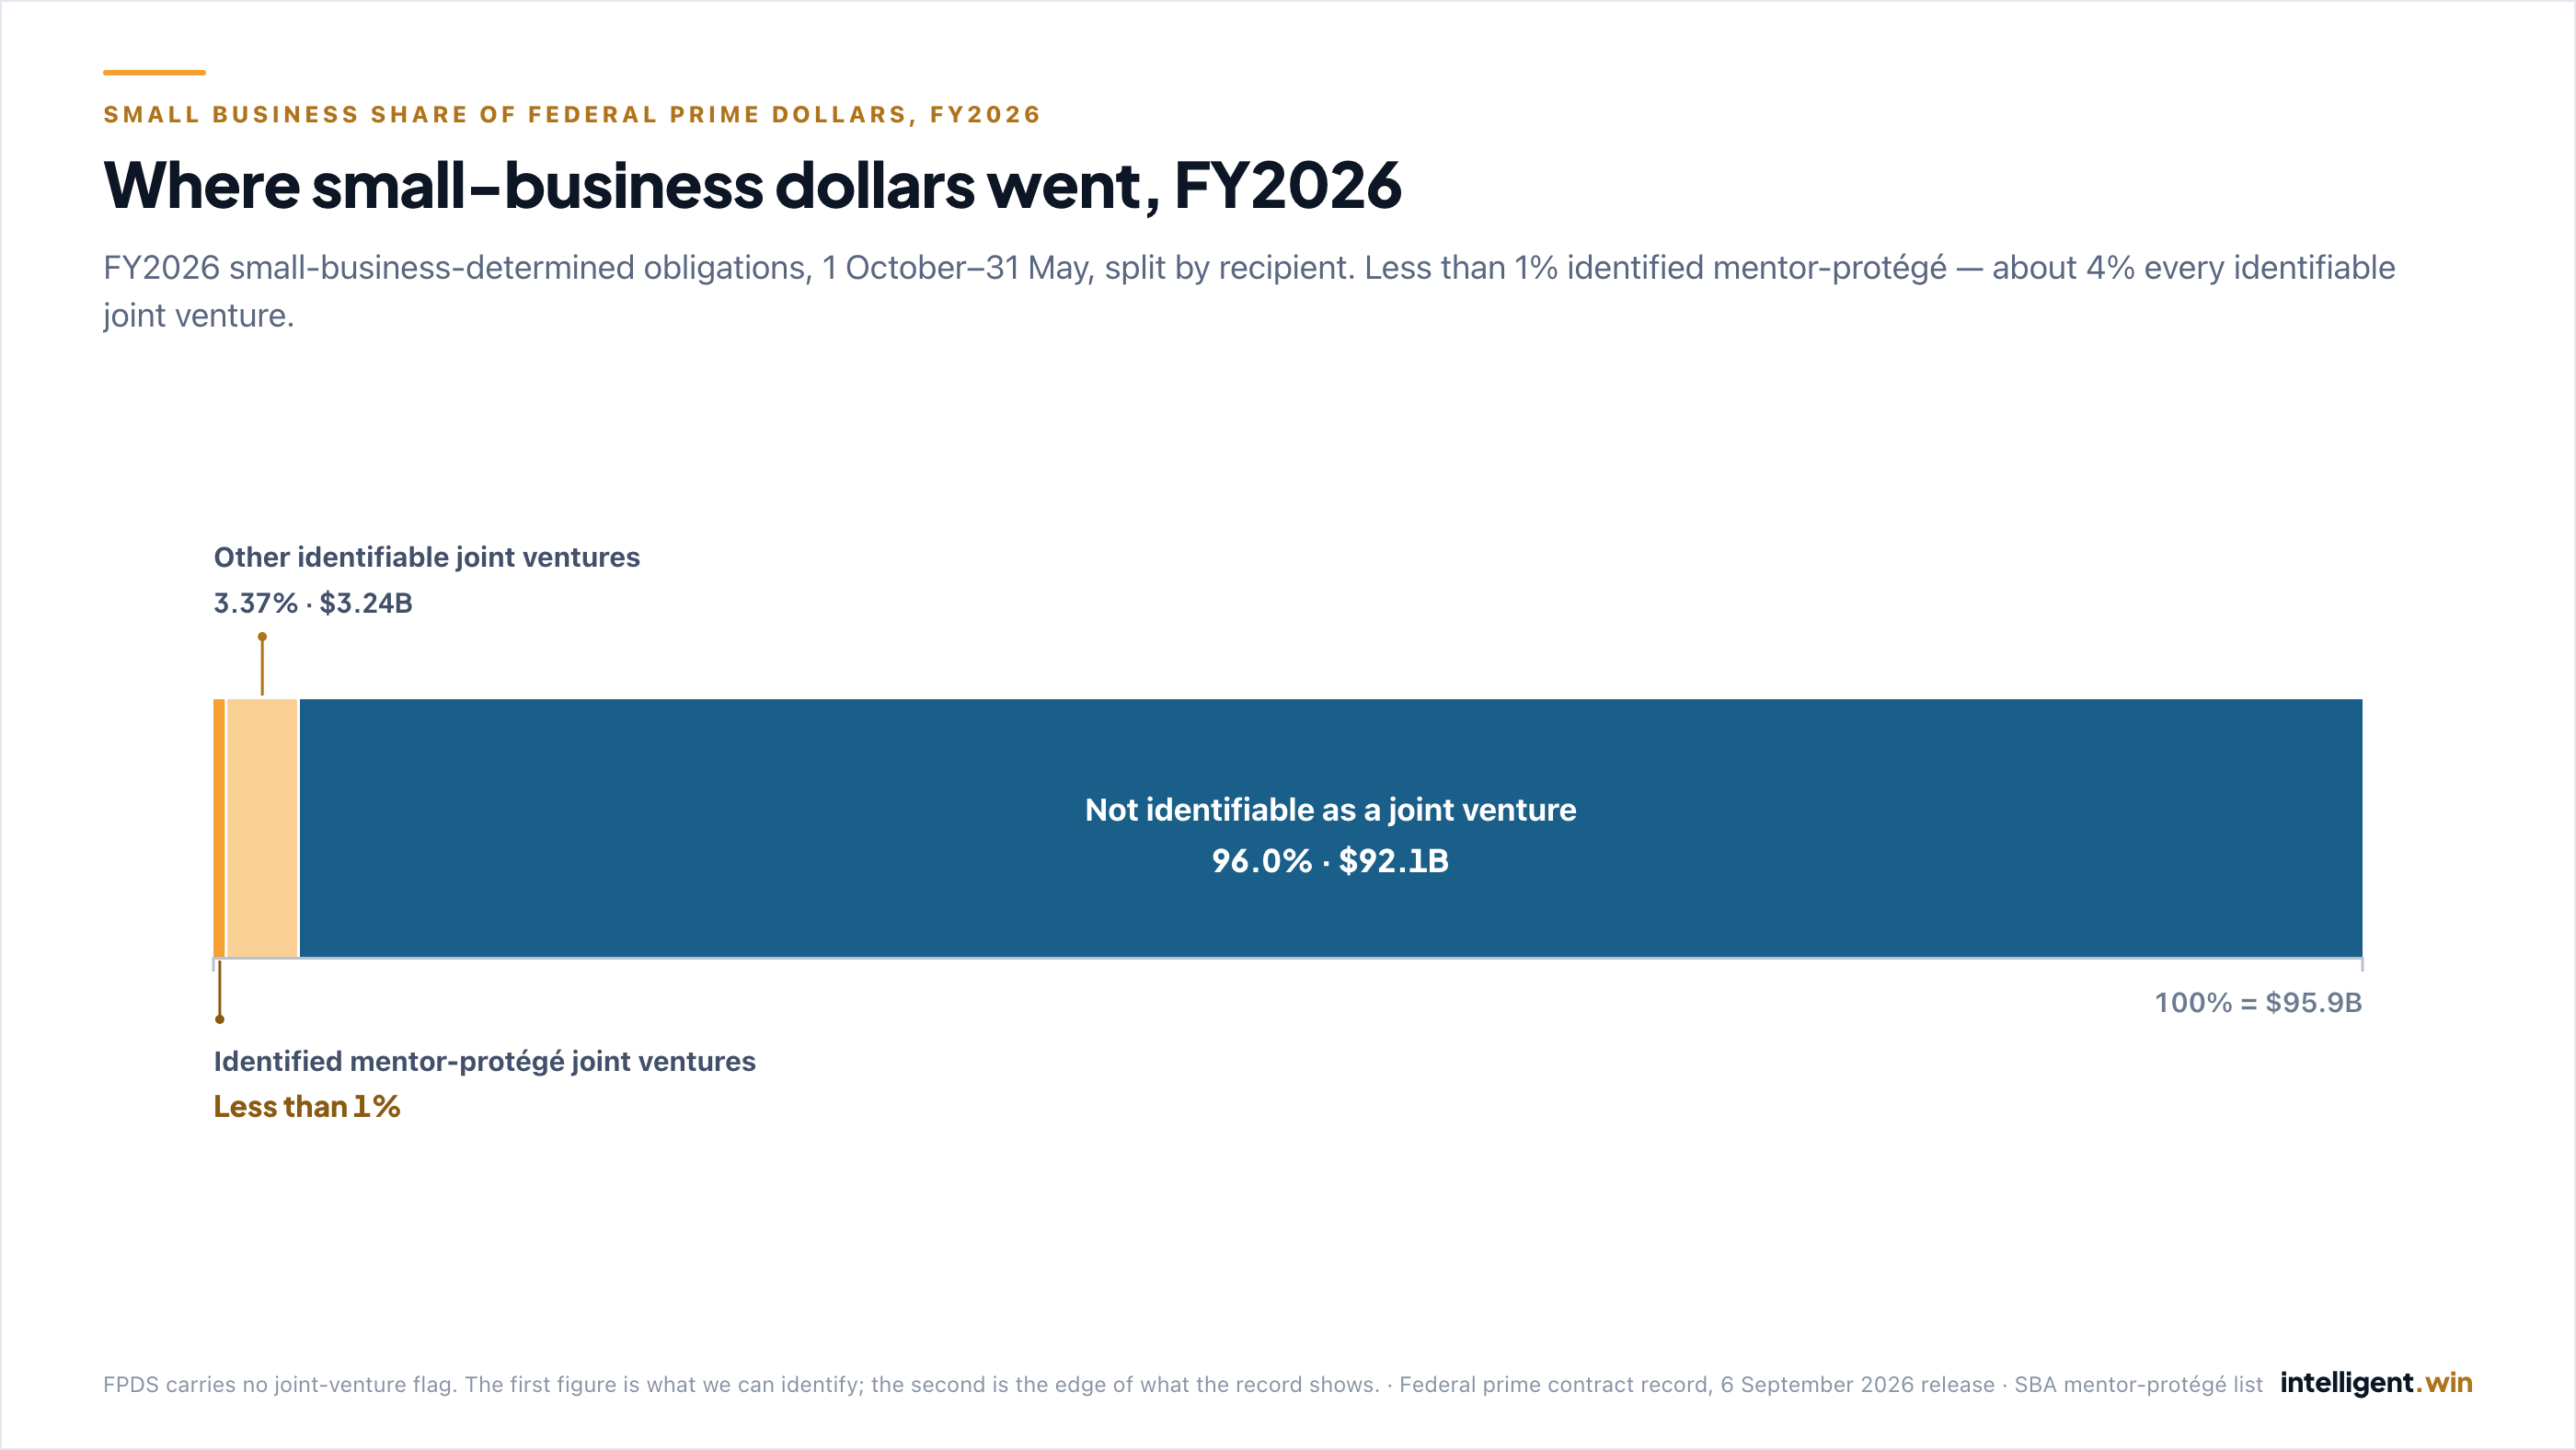
Small businesses have drawn more federal contract money this fiscal year than in any comparable stretch of the last six years. Their share of the total is the lowest over the same six years. Both are true because everything else grew faster. Here is where the small-business money went, including how much went to SBA mentor-protégé joint ventures, where the mentor can be a large business: less than 1% of it, and about 4% for every joint venture we can identify.
Intelligent Win · Market Intelligence — measured on intelligent.win’s contract corpus.
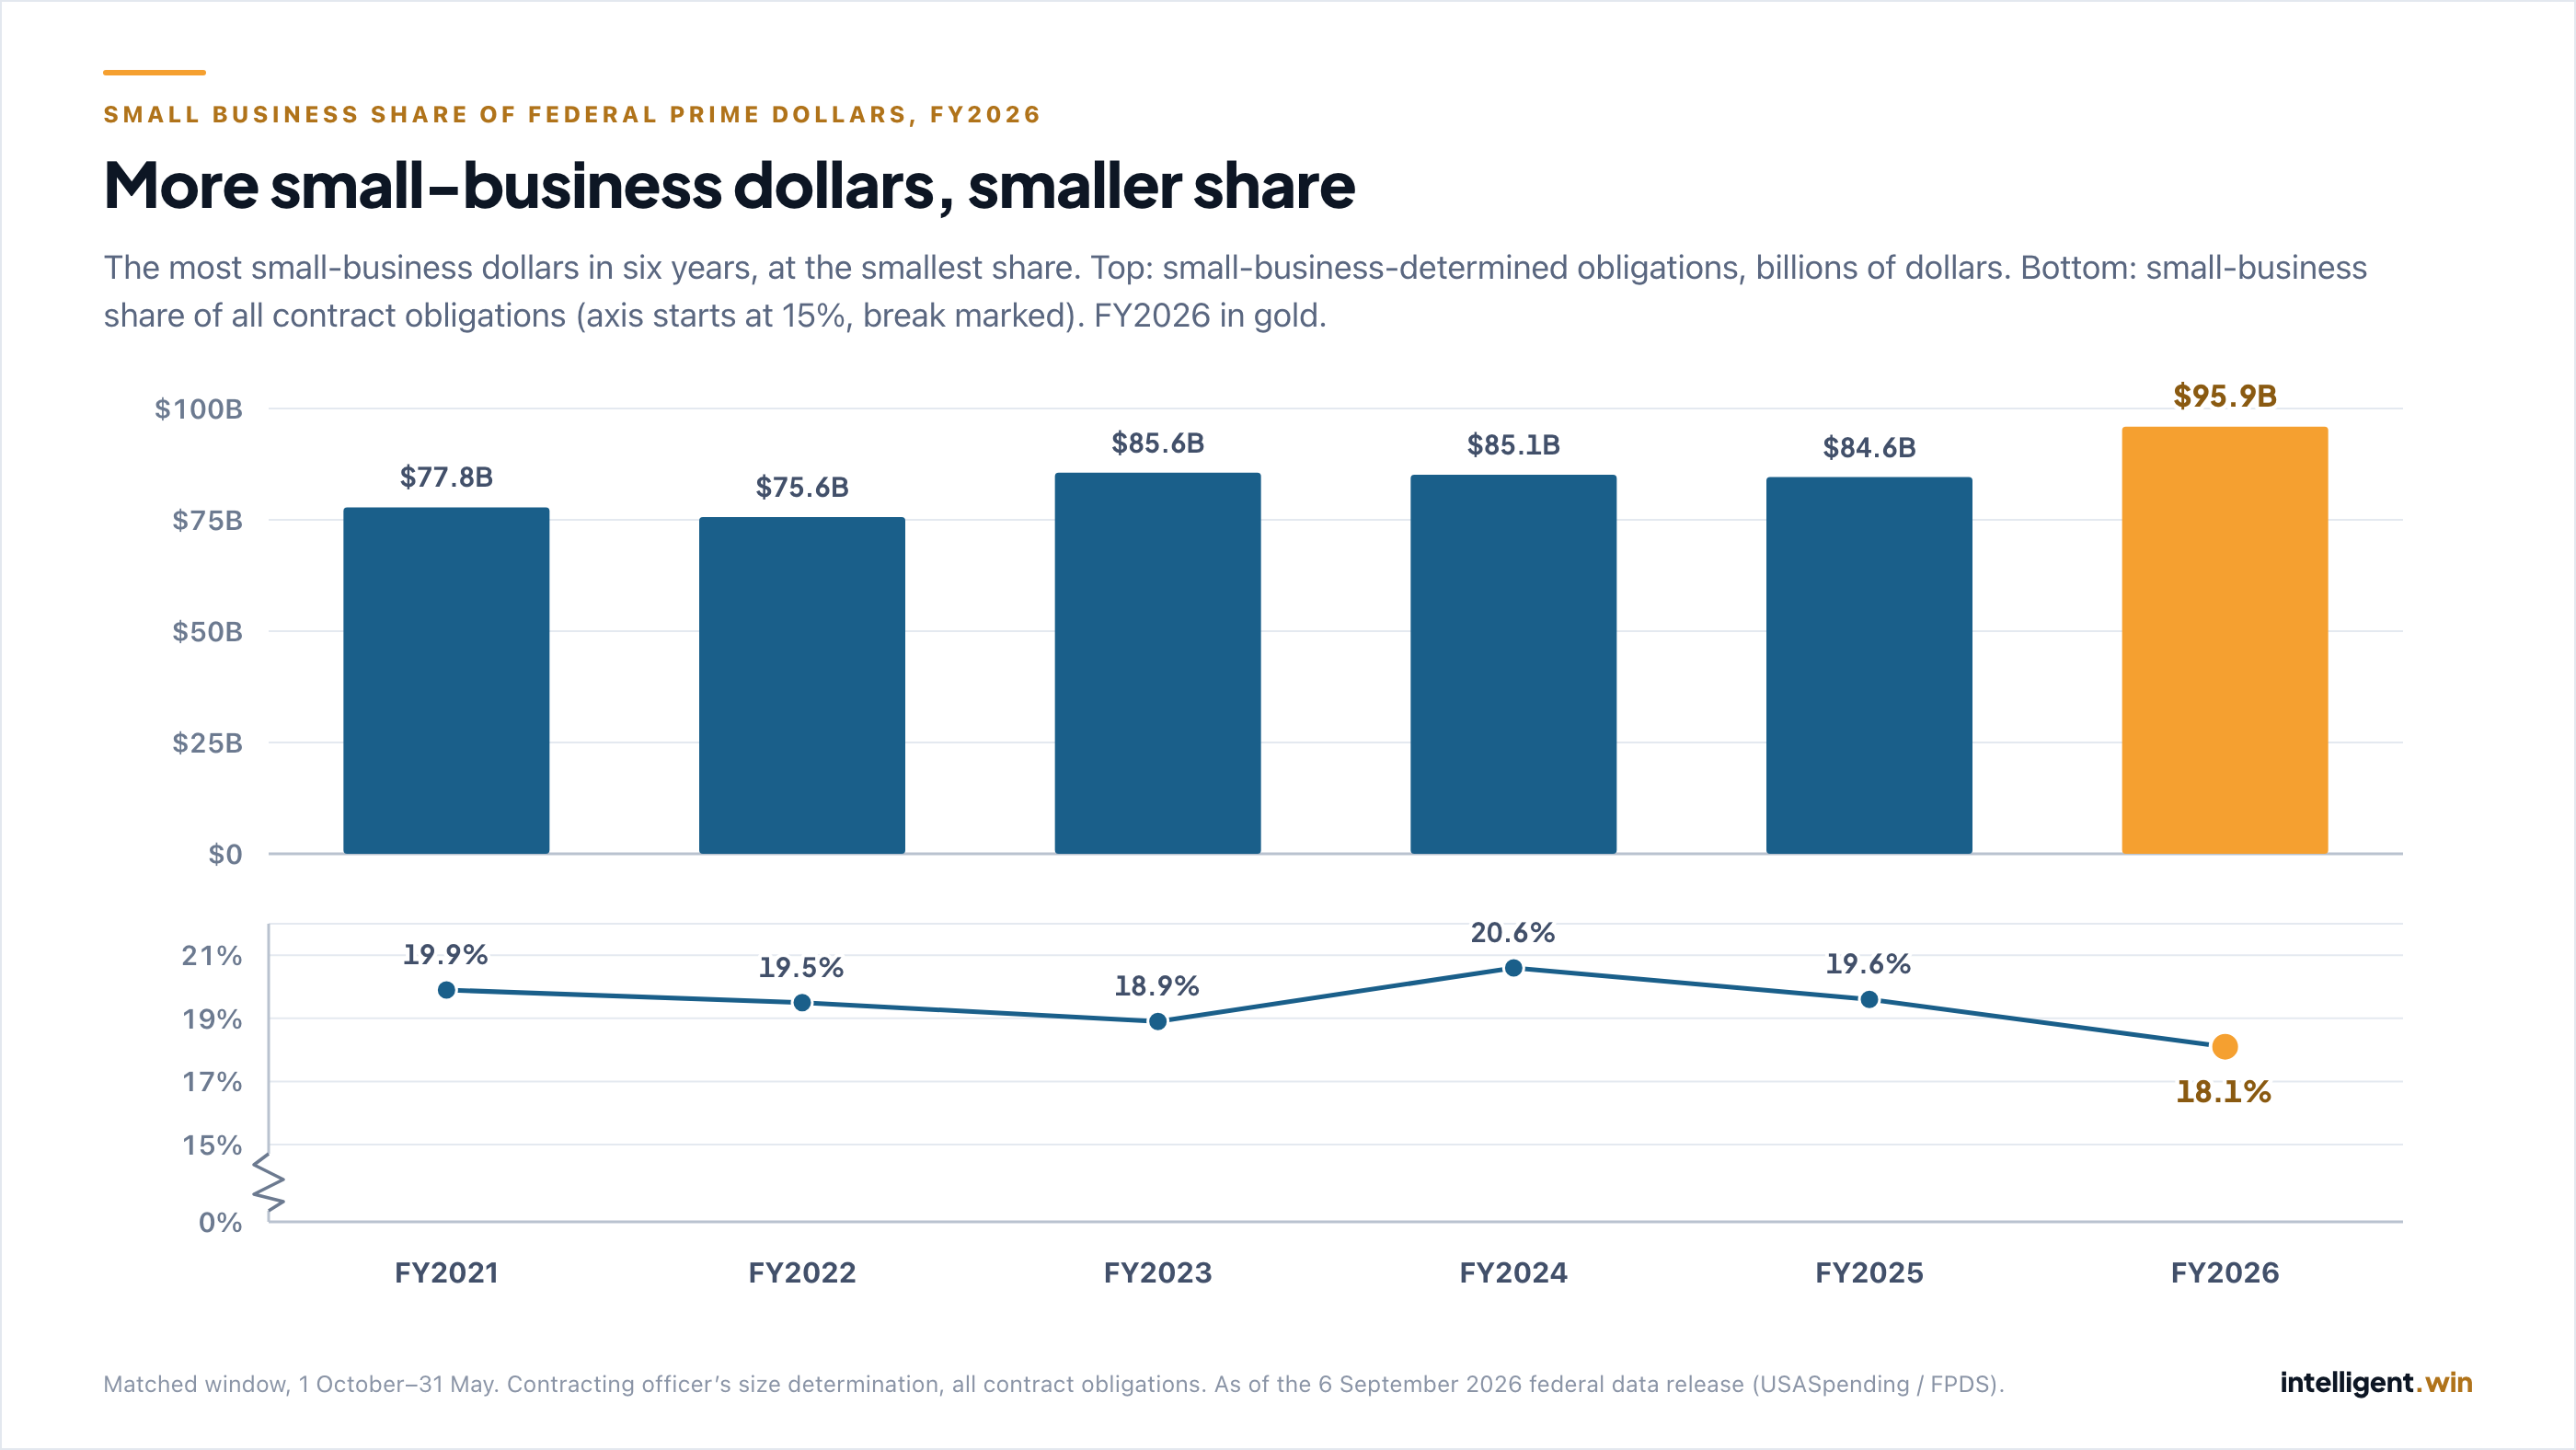
From 1 October through 31 May, federal contracting officers determined the awardee to be a small business on $95.9 billion of contract obligations. That is the most for that eight-month window in any of the last six fiscal years, and 13.3% more than the same window a year earlier ($84.6 billion).
Over the same window, total federal contract obligations reached $529.5 billion, up 22.4%. So the small-business share fell, to 18.1% — from 19.6% a year earlier, and the lowest for this window in six years.
More money. A smaller slice. Both at six-year marks, in opposite directions.
Matched window, 1 October–31 May, FY2026 against FY2025. Contracting officer's size determination on each award, all prime contract obligations.
Six years, same window
| Fiscal year (1 Oct–31 May) | All contract obligations | Small-business-determined | Share |
|---|---|---|---|
| FY2021 | $391.1B | $77.8B | 19.9% |
| FY2022 | $387.9B | $75.6B | 19.5% |
| FY2023 | $452.3B | $85.6B | 18.9% |
| FY2024 | $413.9B | $85.1B | 20.6% |
| FY2025 | $432.6B | $84.6B | 19.6% |
| FY2026 | $529.5B | $95.9B | 18.1% |
Every figure in this piece stops at 31 May, in both years, and the reason is not optional: Department of Defense contract records in this release end in the first week of June. Defense publishes on a delay of roughly 90 days, so June 2026 is only about a fifth reported for DoD and July and August are close to empty, while the same months of 2025 are complete. Any window that runs past May compares a partial year against a whole one.
Where the gap opened
The small-business dollar line grew. Everything else grew faster: obligations determined other than small rose 24.6%, from $348.0 billion to $433.6 billion.
The small-business growth itself is concentrated in large awards. Small-business-determined awards that received $10 million or more inside the window carried $35.7 billion this year against $26.1 billion last year — $9.7 billion of the $11.2 billion increase, or 86% of it. Everything under $10 million moved from $58.5 billion to $60.1 billion.
And the number of awards went the other way. 1,844,933 distinct awards carried a small-business determination this window, against 1,962,798 a year earlier — 117,865 fewer, −6.0%. More small-business money, on fewer awards, weighted toward the big ones.
Four things we did to try to break it
Take out construction. Civilian construction obligations went from $3.5 billion to $26.2 billion in this window, and only 8.9% of this year’s civilian construction dollars carry a small-business determination. That is a large new block of spending landing mostly outside small business, and it pulls the share down. Remove all construction (every Product or Service Code beginning with Y) and the all-agency share is 18.55% — still the lowest of the six years, but only just: FY2023 read 18.68%.
Split defense from civilian. The civilian share is where the drop is sharp: 18.8%, against 21.4% to 23.1% in the five prior years. Remove construction from the civilian side as well and it reads 20.3% — still the lowest of six, against a prior low of 21.1%. The defense share is 17.6%, down from 18.5% last year but not a six-year low: FY2023 read 16.7%.
Count only positive obligations. Deobligations are netted in every figure above. Counting only money going out, the share is 18.39% — again the lowest of the six, against a prior range of 19.2% to 21.0%.
Check the undetermined dollars. Every FY2026 transaction in the window carries a size determination except one, worth $2,813. There is no unclassified pool moving the share.
So the direction holds on every cut. The size of it does not: most of the civilian drop is a single category of new spending, and outside it the all-agency share sits a fraction of a point under its prior low.
How much went to SBA mentor-protégé joint ventures
Under SBA’s rules, a joint venture between a protégé and its approved mentor can compete as small for a contract if the protégé qualifies as small for that contract’s size standard — even when the mentor is a large business. So some of the dollars above sit with awardees that count as small and can have a large firm inside them. We wanted to know how many.
The federal contract record cannot answer that directly. FPDS carries no mentor-protégé flag and no joint-venture flag. Every figure below is an identification we made ourselves, and we measured it three ways so the gap between them is visible.
| Identification | FY2026 small-business dollars | Share of all small-business dollars | Awards |
|---|---|---|---|
| Identified mentor-protégé JVs — our own classification, plus JV awardees matched to SBA’s active mentor-protégé agreement list | — | Less than 1% | — |
| Every awardee whose registered name says it is a JV (“JV”, “J.V.”, “Joint Venture”) | $3.21B | 3.34% | 4,892 |
| Every awardee we can identify as a JV of any kind | About $3.8B | About 4% | — |
| Awardees we could not identify as a JV of any kind | About $92.1B | About 96% | — |
1 October–31 May FY2026. The first row is what we can identify as mentor-protégé; the Methodology explains why it is stated as a range below 1%, not as a floor. The third row is the outer edge of what the record lets us see — not a hard ceiling, because a JV with no JV token in its name and no match in our classification is invisible to all three measures.
The identified mentor-protégé share is small: less than 1% of small-business dollars. Every joint venture we can identify, of any type, adds up to about 4%. The remaining 96% went to awardees we could not identify as a joint venture at all.
The same holds among the largest awards. Among the 1,378 small-business-determined awards that received $10 million or more in the window, 13 went to identified mentor-protégé JVs — under 1% of the $35.7 billion. Joint-venture-named awardees held 58 of those awards and 4.3% of the dollars.
The record has no flag for joint ventures of any kind — so every figure here is an identification we made, and we show how far it reaches.
What moves over time — and what we will not claim. Using one fixed rule every year — the name test in the second row — joint-venture-named awardees held 2.25%, 2.57%, 2.99%, 2.72%, 2.63% and 3.34% of small-business dollars in the FY2021 through FY2026 windows. That is a like-for-like comparison, and it is not a steady rise: FY2025 read lower than FY2023. It includes joint ventures of every kind, not only mentor-protégé.
We are not publishing a mentor-protégé trend. Our identified figure rises across the six years, but the SBA list we match against carries only agreements active today, and our own classification was built from recent awardees. Earlier years are undercounted more than recent ones. That rise is at least partly our identification getting better, and we cannot separate the two, so we are not publishing the year-by-year figure.
How this differs from the SBA scorecard
This is not the SBA small-business procurement scorecard, and the two percentages should not be read against each other.
| This piece | SBA scorecard | |
|---|---|---|
| What counts as small | The contracting officer’s size determination recorded on each award | Small-business status on each award, applied to a goaling base |
| Base | Every federal prime contract obligation in the window, nothing removed | A goal-eligible base, with several categories of spending excluded before the percentage is computed |
| Window | 1 October–31 May, matched across years | A full fiscal year |
| Purpose | Watch the record move inside the year | Measure agencies against statutory goals |
Neither is the “right” number. They answer different questions. The scorecard grades performance against goals; this measures where the obligation record stands partway through a year, on a base nobody has trimmed. We make no statement about whether any agency is meeting its goals.
A second reason not to compare: in all six completed fiscal years we can measure both ways (FY2020–FY2025), the small-business share of the whole year read higher than its October–May share — 23.3% for all of FY2024 against 20.6% for its October–May window, 21.8% for all of FY2025 against 19.6%. The final four months change the number. FY2026’s full-year figure is not knowable until defense data for June through September is published.
What this does and does not say
It says small businesses are receiving more contract money than in any comparable window of the last six years, that their share is at a six-year low for the same window because other spending grew faster, and that the largest single driver of the civilian drop is new construction spending that mostly carries an other-than-small determination.
It says identified mentor-protégé joint ventures account for less than 1% of small-business dollars, and that every joint venture we can identify accounts for about 4%.
It does not say any particular firm is or is not small — the size determination is the contracting officer’s, recorded per award, and we report it as recorded. It does not say whether mentor-protégé joint ventures are good or bad for small business. It does not say what the full-year FY2026 share will be.
This piece stops at the government-wide total on purpose. The joint ventures themselves — their member companies, the buying offices and NAICS codes they win under, and who else holds small-business awards at the same offices — are what the platform is for. See plans →
These numbers came out of the platform, not a spreadsheet.
The same contract corpus behind this note — 2.6 million contracts, reconciled against the government’s own published totals before anything publishes — is what the product runs on. If you want to see how it’s assembled and checked, that’s written up in full.