Market Note · 15 September 2026
Federal Contract Labor Rates, FY2025
Every federal agency has to publish, contract by contract, how many contractor labor hours it bought and what it was invoiced against them. Almost nobody reads the file. Here is what it shows for FY2025 — starting with why the number everyone calls a labor rate is not one, which turns out to be the most useful thing about it.
Intelligent Win · Market Intelligence — measured on intelligent.win’s contract corpus.
Federal agencies publish a Service Contract Inventory each year. For each service contract it carries two reported elements: the contractor direct labor hours expended, and the total dollars invoiced. Divide the second by the first and you get a per-hour figure.
In FY2025 the median was $147.43 per direct labor hour, across 32,205 contract filings. In FY2024 it was $142.43, across 37,528.
Both years run together through every table, every band and every coverage figure in this piece, and there is a measured reason for that which appears further down.
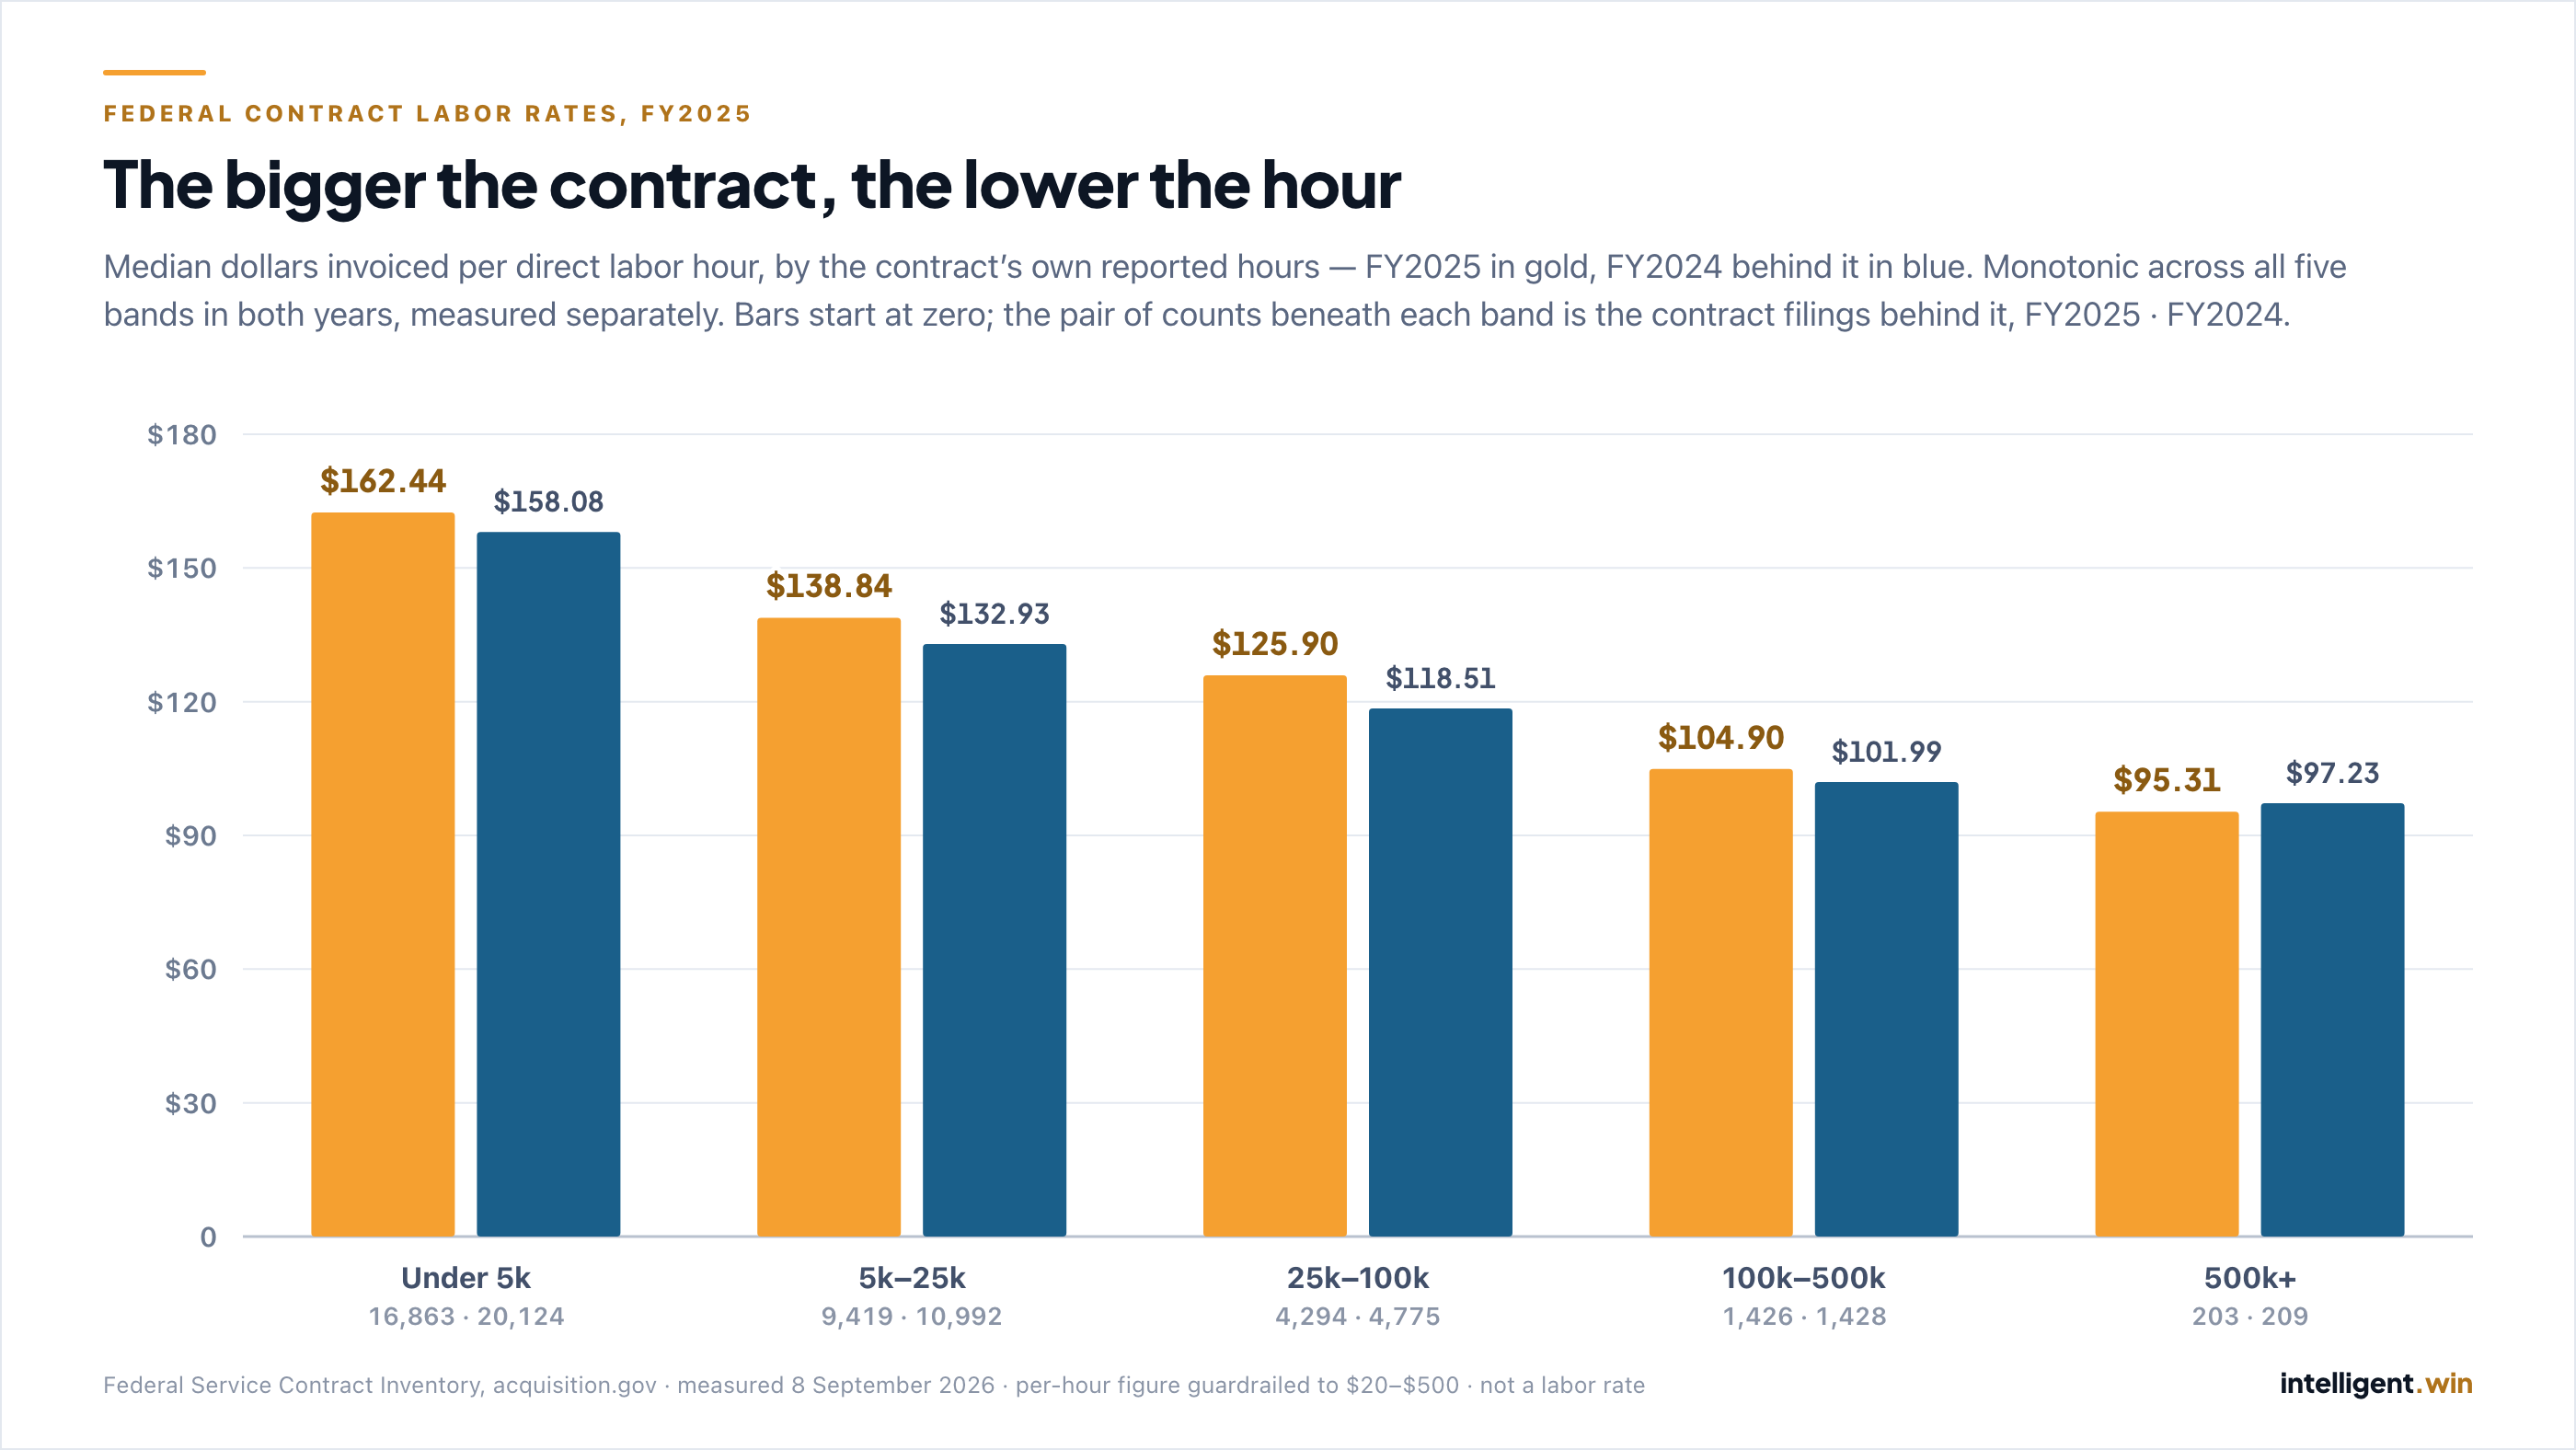
The per-hour figure falls at every step as reported hours rise — and it does so in both years independently:
| Contract size, by reported hours | FY2025 | FY2024 |
|---|---|---|
| Under 5,000 hours | $162.44 | $158.08 |
| 5,000 – 25,000 hours | $138.84 | $132.93 |
| 25,000 – 100,000 hours | $125.90 | $118.51 |
| 100,000 – 500,000 hours | $104.90 | $101.99 |
| Over 500,000 hours | $95.31 | $97.23 |
Smallest band to largest: a 41% slide in FY2025, and a 38% slide in FY2024. Monotonic across all five bands, in both years, measured separately.
That independent replication is the whole reason this is publishable. One year’s monotonic slope is a shape; the same shape in a different year, over a different and larger set of reporters, is a pattern.
What it is not is an explanation. Nothing in this file measures why the figure falls as contracts get larger, and this piece does not guess. Larger contracts carry a different mix of work, a different mix of contract types, and a different mix of non-labor cost inside the same invoiced total. Any of those moves this number. The slide is an observation about the record, and it stops there.
Federal Service Contract Inventory, FY2016–FY2025.
It is not a labor rate, and that is the most useful thing about it
The dollars figure in this file is defined by FAR 52.204-14 as “the total dollar amount invoiced for services performed during the previous Government fiscal year under the contract” — and by FAR 52.204-15 in identical wording at the order level. The hours figure is defined separately, in its own paragraph, as contractor direct labor hours.
Two separately defined elements. The dollars element carries no instruction to exclude materials, equipment, travel, or other direct costs, because it was never scoped to labor in the first place. The inventory exists so agencies can track how much of their mission is contracted out — a workforce-reliance measure, not a cost-accounting one. A total-invoiced figure serves that purpose perfectly well without isolating labor.
So the quotient is directional. It behaves closest to a real hourly billing figure on time-and-materials and labor-hour work, where the invoice is contractually tied to hours worked in the same period. It behaves worst on fixed-price work in materials-heavy, equipment-heavy or construction-flavoured categories, where the invoiced total in a fiscal year can be a milestone payment carrying substantial cost that has nothing to do with the hours reported beside it. Our own research on this file measured the same categories of work, invoiced the two different ways, producing composites several times apart.
No contract invoiced $147.43 an hour. That sentence is the one thing this dataset cannot support, and it is the sentence every article written on this query wants to write.
What the figure is good for is comparison — band against band, year against year, on a consistent measure — which is exactly what the table above does and exactly what the rest of this piece is limited to.
One more disclosure that belongs in this section rather than in a footnote. The divisor used throughout is prime direct labor hours. Under DFARS 252.204-7023, DoD’s own reporting instruction folds first-tier subcontractor direct labor hours into the hours a prime reports, where the civilian FAR clause has subcontractors report separately. So “prime hours” is not a consistent quantity across the whole government, and it is the government’s own instruction that makes it inconsistent, not sloppy filing.
Four things we did to try to break it
Test 1 — did we compute the median correctly? No, not the first time.
This is the one worth reading, because it is our own error and internal Red Cell Analyst caught it before anyone else could.
The first version of this measurement selected the wrong row. In the largest size band — contracts over 500,000 reported hours — the FY2025 population is 203 filings. 203 is odd, so the median is unambiguously the 102nd value. Sorted, the three values around the middle are:
| rank 101 | rank 102 — the median | rank 103 |
|---|---|---|
| $93.4381 | $95.3053 | $95.8356 |
We had published $95.84. That is rank 103 — one position above the middle, the classic off-by-one you get from an offset rank rather than a true percentile. The correct figure is $95.31.
Every population count in that first version was exactly right — every one of them, to the row. Every dollar figure was slightly wrong. Counts are hard to get wrong and easy to check; statistics are the opposite, which is why the derivation is now a version-controlled query file with its own recorded output, and why a reader running the stated method gets the digits printed here rather than something close to them.
Test 2 — does the size pattern replicate? Yes, and that is the load-bearing test in this piece. Monotonic across all five bands in FY2025, and independently monotonic across all five in FY2024, on a larger population. A pattern that survives being re-measured on a different year’s reporters is a different kind of claim from one that does not.
Test 3 — is FY2025 completely reported? Possibly not, so FY2024 runs beside FY2025 through every table, every band and every coverage figure here.
Fewer contract-years filed a usable hours-and-dollars pair in FY2025 than in FY2024: 42,118 against 47,157. That is a real drop, and we have not measured what is in it — later filing, genuinely fewer covered contracts, or something else. Rather than explain it, we publish FY2024 beside every FY2025 figure and let the reader see both.
Test 4 — are we counting contracts, or filings? Filings, and the noun matters.
The deduplication key in this file is the contract number plus the referencing vehicle, so a contract running under two different vehicles is two rows. The FY2025 population is 32,205 filings across 30,640 distinct contract numbers — 5.1% more filings than contracts. FY2024 is 37,528 filings across 35,310 distinct contracts.
Every count printed beside a median in this piece is the filings count, because that is the population the median was actually computed over. Publishing the distinct-contract count next to a median computed over filings would be a smaller-sounding number attached to the wrong population, which is how this kind of page goes quietly wrong.
The size slide
| Contract size, by reported hours | FY2025 median | FY2025 filings | FY2024 median | FY2024 filings |
|---|---|---|---|---|
| Under 5,000 hours | $162.44 | 16,863 | $158.08 | 20,124 |
| 5,000 – 25,000 hours | $138.84 | 9,419 | $132.93 | 10,992 |
| 25,000 – 100,000 hours | $125.90 | 4,294 | $118.51 | 4,775 |
| 100,000 – 500,000 hours | $104.90 | 1,426 | $101.99 | 1,428 |
| Over 500,000 hours | $95.31 | 203 | $97.23 | 209 |
| All filings | $147.43 | 32,205 | $142.43 | 37,528 |
The band counts add up to the totals, in both columns. A reader can check that with a calculator, and should.
Two details in that table are worth naming rather than leaving to be spotted.
The smallest band is the biggest population. More than half of FY2025’s filings — 16,863 of 32,205 — are filings from contracts reporting under 5,000 hours in the year. The high end of this measure is also its crowded end.
The largest band is the one band that fell year over year. Four of the five bands read higher in FY2025 than FY2024; contracts over 500,000 hours read lower ($95.31 against $97.23). It is also by far the thinnest band — 203 filings — so it is the figure in the table most exposed to a handful of reporters moving.
We publish it because leaving out the one band that moves against the grain is how a table stops being a measurement.
Ten years, and the reason to read the line carefully
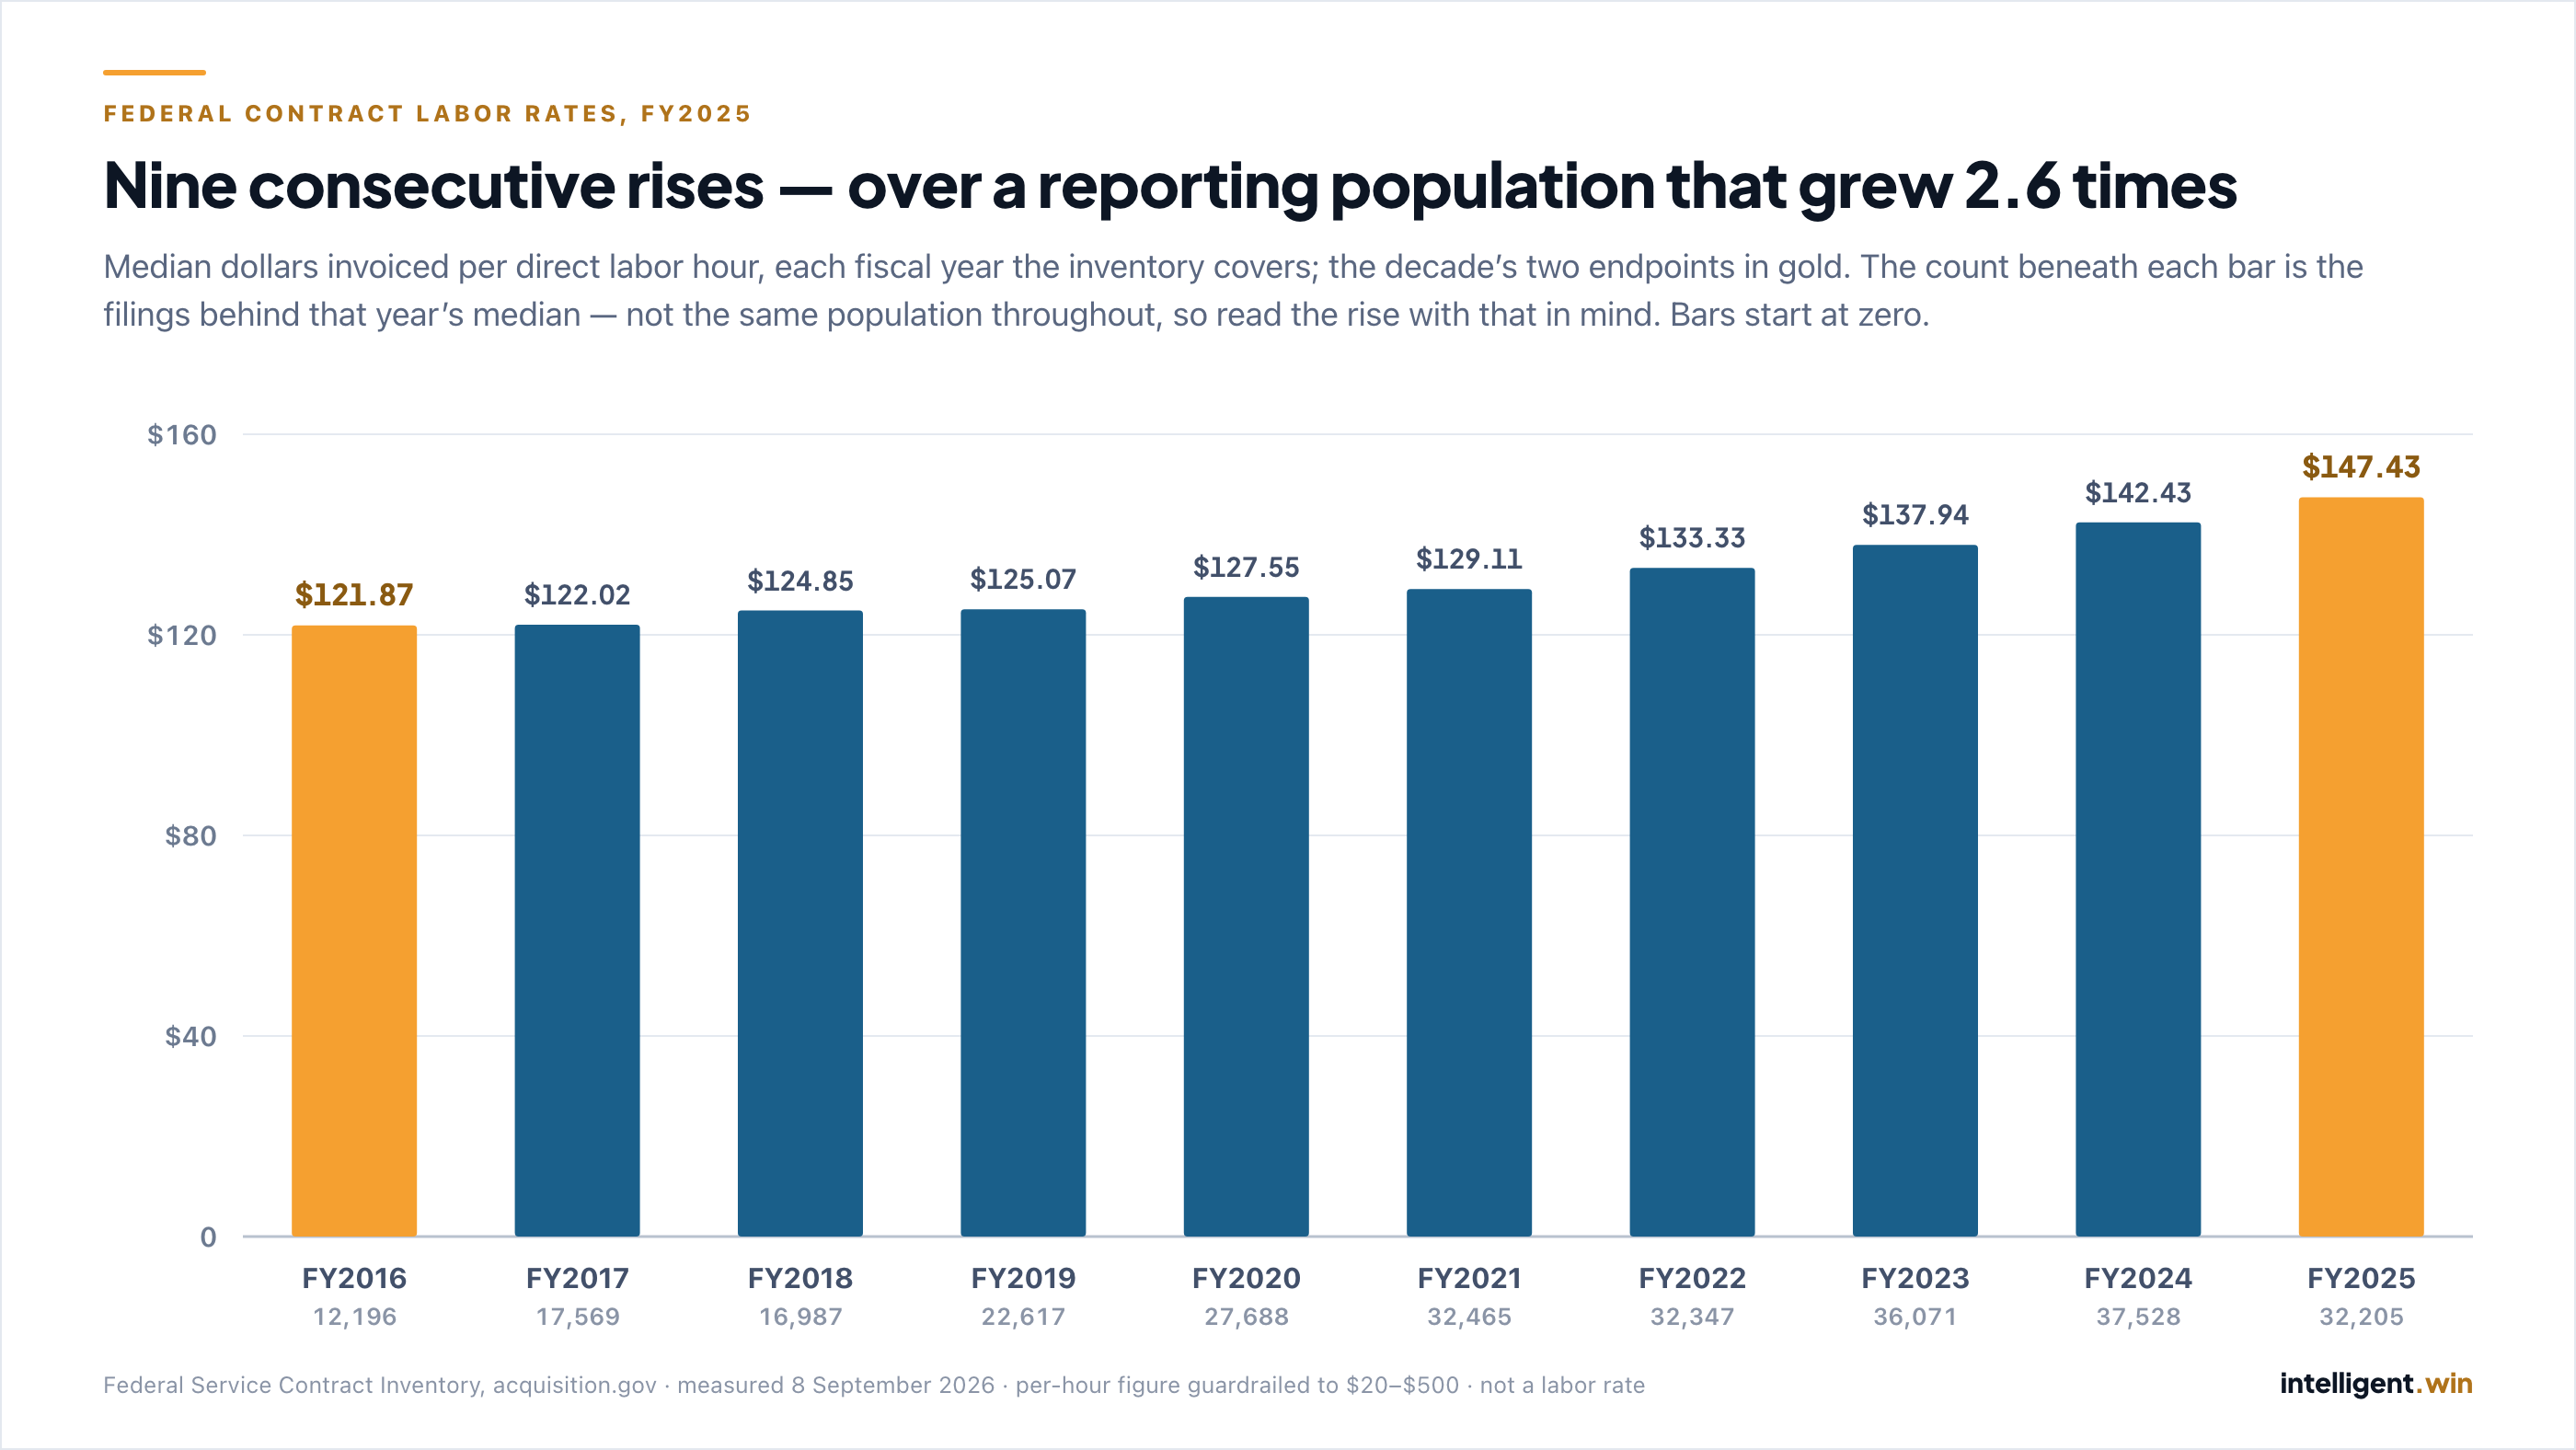
The file opens in FY2016. Across the ten years it covers, the median reads higher in every year than the year before it — nine consecutive year-over-year rises, from $121.87 to $147.43, a 21% change over the decade.
| Fiscal year | Median | Contract filings |
|---|---|---|
| FY2016 | $121.87 | 12,196 |
| FY2017 | $122.02 | 17,569 |
| FY2018 | $124.85 | 16,987 |
| FY2019 | $125.07 | 22,617 |
| FY2020 | $127.55 | 27,688 |
| FY2021 | $129.11 | 32,465 |
| FY2022 | $133.33 | 32,347 |
| FY2023 | $137.94 | 36,071 |
| FY2024 | $142.43 | 37,528 |
| FY2025 | $147.43 | 32,205 |
Now the caveat, and it is a real one rather than a decorative one: the population under that line grew to 2.6 times its FY2016 size, having peaked at 3.1 times in FY2024. FY2016 rests on 12,196 filings, FY2024 on 37,528, and FY2025 on 32,205 — and that fall-back between the last two years is the FY2025 completeness question from Test 3 showing up again. The set of contracts reporting into this file in 2016 is not the set reporting into it in 2025, and a measure taken over a growing, shifting population can move because the population moved.
We have not published a test that separates those two things, so we are not claiming to have separated them. A within-work-category check — holding the type of work constant and asking whether the figure still rises — is the test that would do it. Ours did not survive independent re-measurement, so it is not in this piece and nothing here leans on it.
What is left is still worth printing, stated at its true strength: over the ten years the file covers, the median reads higher every year, and the reporting population grew substantially over the same period. Both of those are facts about the record. Which share of the first is explained by the second is not something this file has told us yet.
That is a weaker claim than the one we could have written. It is the one the evidence currently supports.
What you can actually do with it
Use the band, not the headline. A single government-wide median is a headline. The useful row is the one matching the size of the work in front of you. A 3,000-hour task order and a 600,000-hour services contract sit in the same FY2025 record at $162.44 and $95.31 respectively — $158.08 and $97.23 in FY2024 — and reading either one against the all-filings figure of $147.43 ($142.43 in FY2024) puts you the wrong distance from what the record actually reports for work of that shape.
Read it as a comparison, never as a build-up. This figure carries whatever non-labor cost rode the same invoices. It will not reconcile to a rate build-up and it is not meant to. What it will do is tell you whether the number you have arrived at sits inside or outside what the federal record reports for work of that shape — and where it sits is a question worth being able to answer before someone else asks it.
Know which side of the measure you are on. The closer a contract is to time-and-materials, the closer this figure sits to something recognisable. The closer it is to fixed-price work with real materials content, the further it drifts, in a direction that inflates it.
And check us. The same figures render at intelligent.win/labor-rates, with the filters and the guardrail stated on the page. The page and this piece agree because they read from the same recorded derivation — one query, one constants file — not because two people separately arrived at the same digits.
These numbers came out of the platform, not a spreadsheet.
The same contract corpus behind this note — 2.6 million contracts, reconciled against the government’s own published totals before anything publishes — is what the product runs on. If you want to see how it’s assembled and checked, that’s written up in full.