Market Note · 8 September 2026
The Production Share of OTA Money Went From Zero to One Dollar in Nine
Other transaction authority exists so the government can build a prototype fast and then buy the working version without starting over. Whether that second half actually happens is the central argument about OTAs — and it is usually argued without numbers. Here is what a decade of the government's own Other Transaction record shows, including the three ways the obvious calculation gets it wrong.
Intelligent Win · Market Intelligence — measured on intelligent.win’s contract corpus.
Across the full Other Transaction record — 47,428 reported actions against 8,850 distinct agreement numbers, in a record that opens 4 October 2016 — production agreements account for 9.75% of all obligated dollars.
That number is quoted often and it is misleading, because it averages a decade in which the pathway did not yet exist alongside years in which it did. Split it by year and the real shape appears: production was 0% of OT dollars in FY2017 and FY2018, crossed 1% in FY2019, and reached 11.74% in FY2025 — the most recent year the record covers reliably.
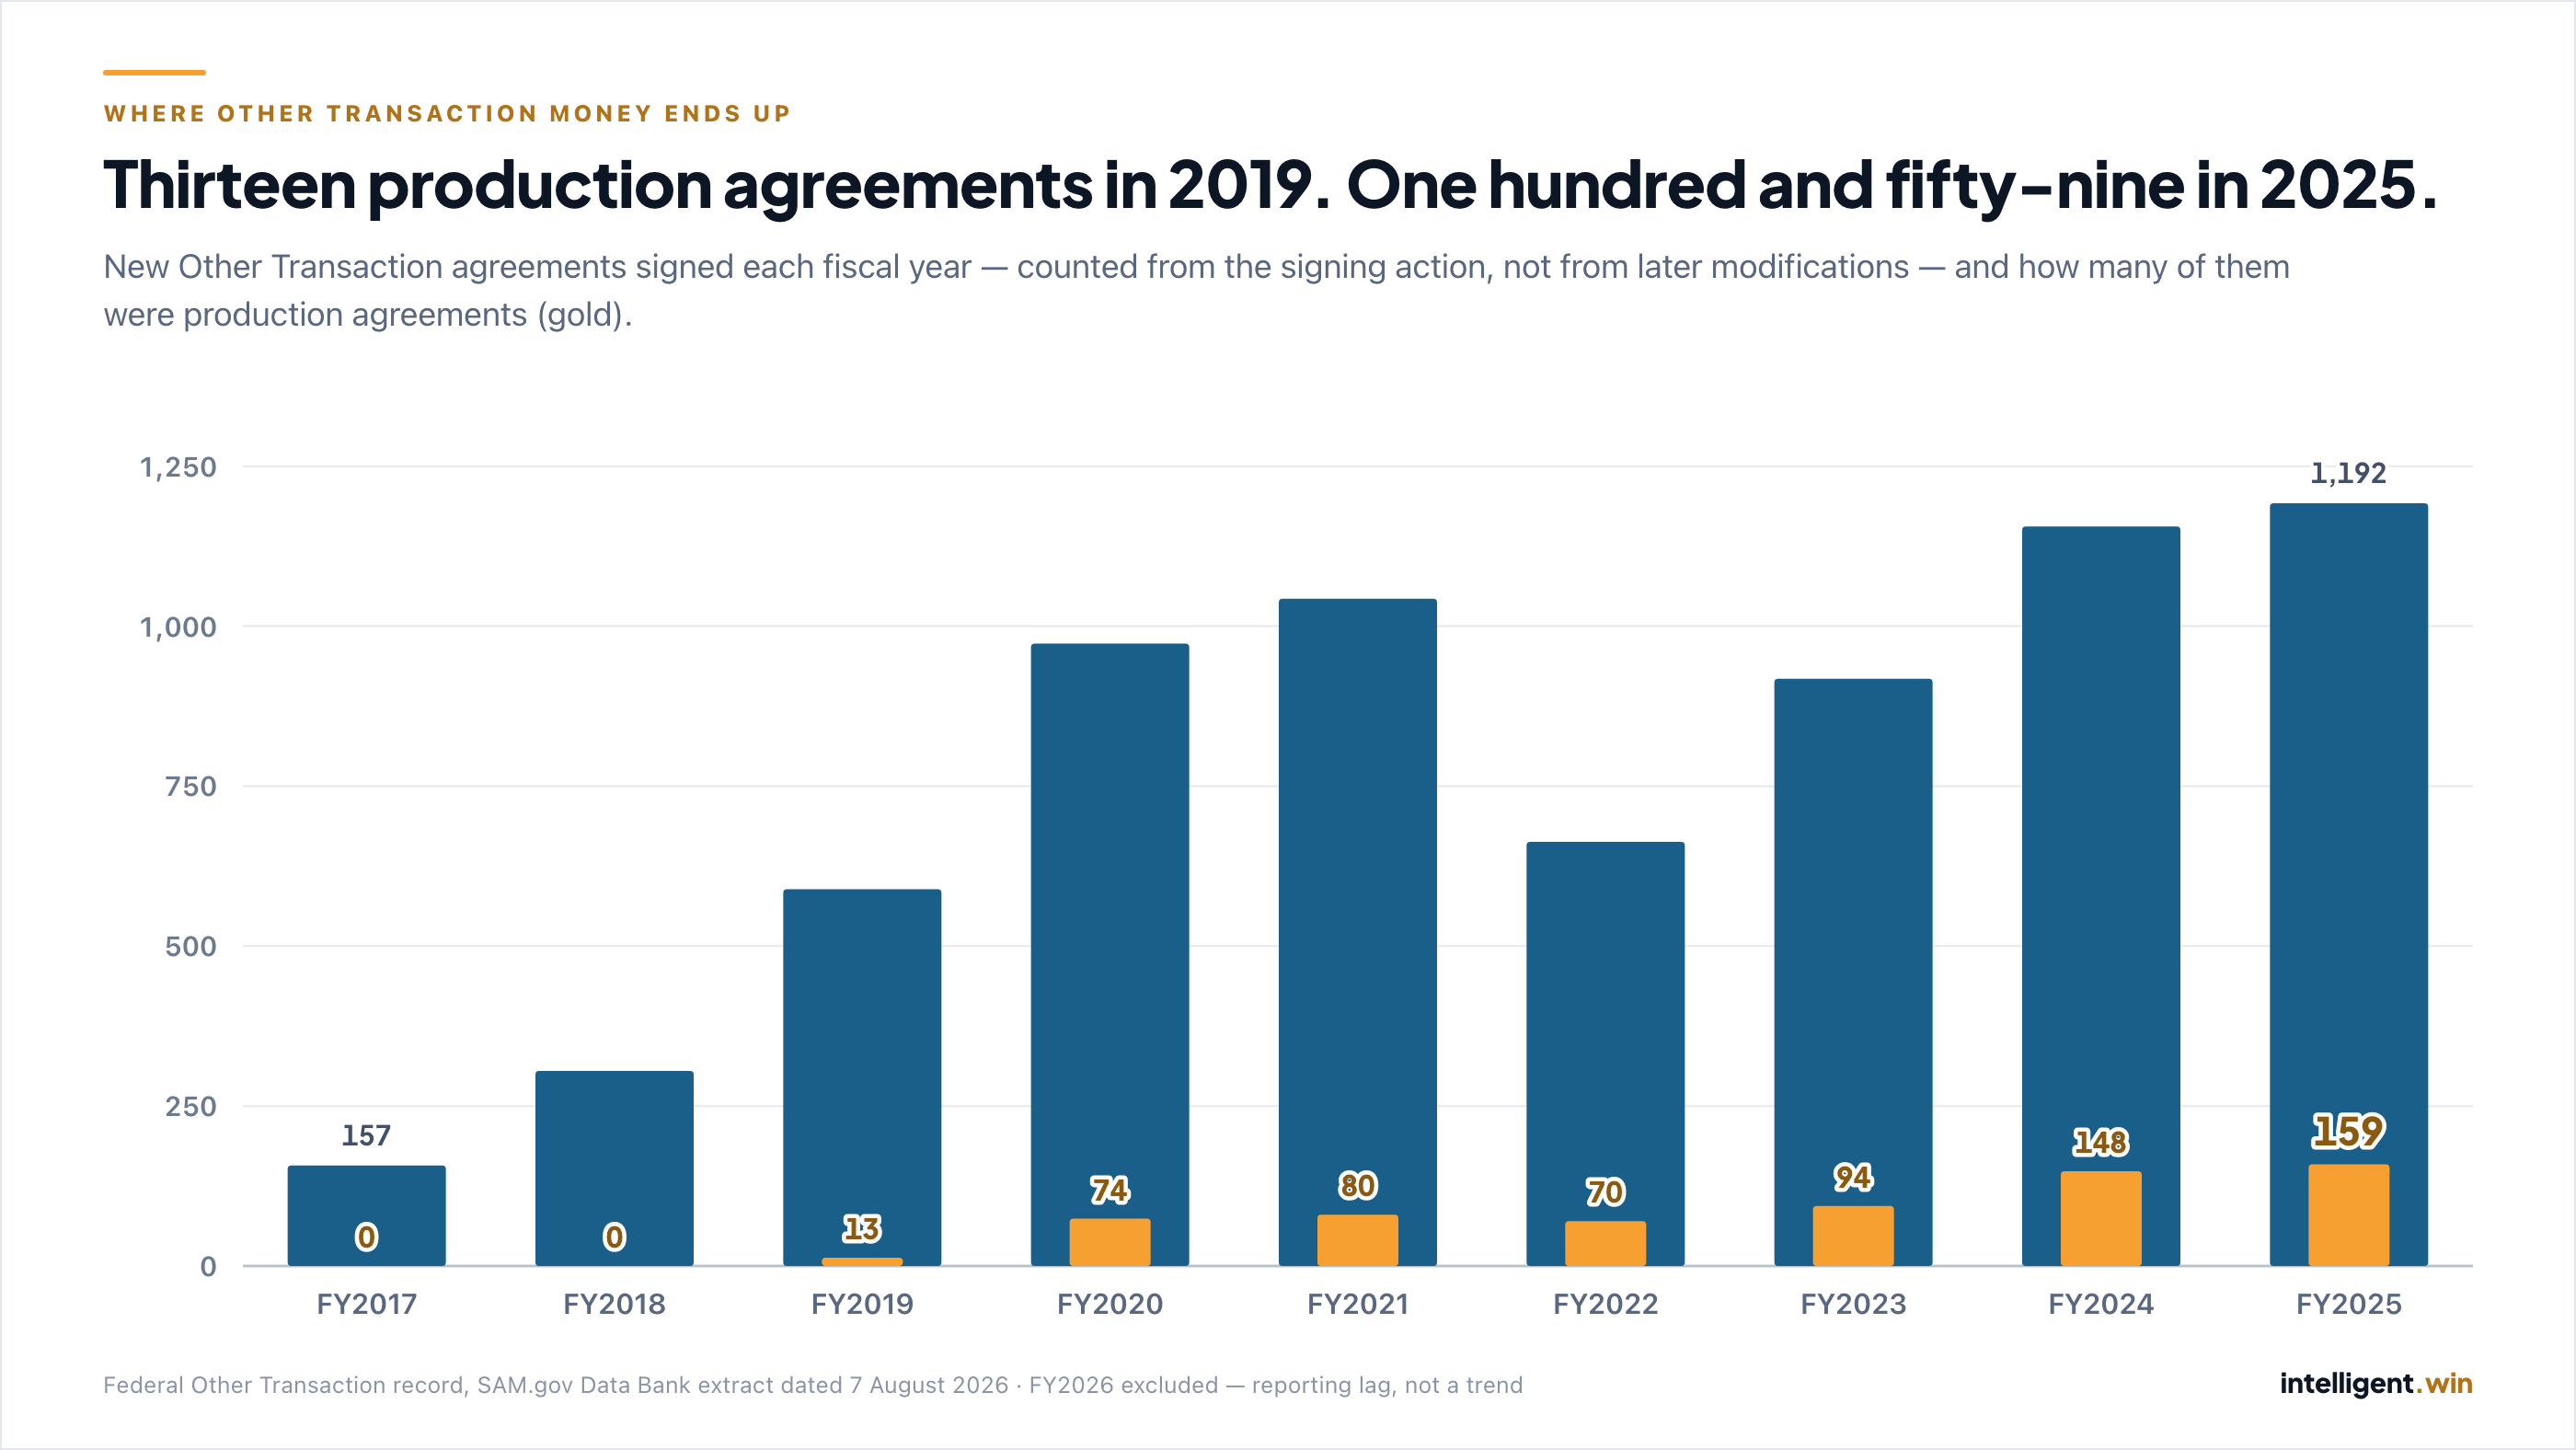
The agreement counts tell the same story. In FY2019, 13 new production agreements were signed. In FY2025 there were 159 — and they made up 13.3% of all new agreements signed that year, against effectively zero six years earlier.
So the honest summary is not that OTAs fail to reach production. It is that the production leg went from nothing to roughly one dollar in nine, and to about one new agreement in seven.
What the data cannot tell you — and this is the limitation that matters most — is the conversion rate of individual prototypes. More on that below, because it is the thing everyone assumes this number means.
Full Other Transaction record, FY2017–FY2025.
The first thing we did was try to break it
Four tests. Every one of them changed what we published.
Test 1 — does the file double-count? Yes, and it is the reason no grand total appears in this piece as a clean figure. The record carries three kinds of row: standalone agreements, base agreements filed as indefinite-delivery vehicles, and orders placed under those vehicles. Every one of the 8,020 order rows references a base vehicle that also exists as its own row in the file. Some base rows carry obligations directly and have orders beneath them — and the relationship runs in both directions with no rule reconciling it. One base agreement reports $5.16 billion while the 31 orders beneath it total $1.14 billion. Another reports $37.8 million while its 193 orders total $1.51 billion. A third reports $400.0 million against 8 orders totalling $174.4 million. A fourth reports nothing at all while its 161 orders carry $4.14 billion.
So we did not pick a scope and hope. Every dollar ratio in this piece is computed twice — once across all rows, once excluding the base-vehicle rows — and both are reported. The production-share finding survives:
| Fiscal year | Production share, all rows | Production share, excluding base vehicles |
|---|---|---|
| FY2017 | 0.00% | 0.00% |
| FY2018 | 0.00% | 0.00% |
| FY2019 | 1.10% | 2.64% |
| FY2020 | 4.38% | 5.12% |
| FY2021 | 8.44% | 7.17% |
| FY2022 | 11.49% | 6.86% |
| FY2023 | 12.69% | 9.29% |
| FY2024 | 11.16% | 9.45% |
| FY2025 | 11.74% | 11.37% |
Different scopes, same story: zero, then a climb, then a band. The all-time figure is 9.75% one way and 9.17% the other.
Test 2 — are we counting agreements, or paperwork? Paperwork, if you are not careful — and this one changed our headline. 39,742 of the 47,428 rows are modifications; only 7,686 are the base action that creates an agreement. Counting distinct agreement numbers per year therefore counts every agreement that had any activity that year, including modifications to agreements signed years earlier. That inflates recent years against early ones, because by FY2025 six years of back-catalogue is accumulating modifications and in FY2019 there was almost none. Every count in this piece is taken from the base action only — agreements actually signed that year.
Test 3 — is the most recent year usable? No, and we cut it. FY2026 initially looked like the strongest year in the series. Then we counted new agreements by month: October 31, November 79, December 106, January 99, February 120, March 146, April 88 — and then May 14, June 0, July 0. That is not a collapse in Other Transaction activity; it is the reporting lag between an agreement being signed and appearing in the published extract. FY2026 is excluded from every figure and chart in this piece.
Test 4 — can we trace a prototype into production? Barely, and not nearly enough. The recorded agreement type never changes within an agreement number anywhere in this file — across 6,993 multi-action agreements it varies zero times, while the contracting organisation varies in 1,366 of them. The field behaves as agreement-level metadata, so the record simply cannot express a prototype converting in place. A partial link does exist, and it is worth being precise rather than absolute about it: 47 production actions across 15 distinct production agreements sit under a base vehicle recorded as a prototype. Fifteen of 702 production agreements is 2.1% coverage — a real trace, and nowhere near enough to compute a conversion rate. Every figure here is a share of dollars and a count of agreements, never a success rate. Anyone quoting an OT “transition rate” from this source is computing something the source cannot support.
The growth is in the count, not just the dollars
Counting agreements actually signed each year — not agreements that merely had paperwork filed — gives the cleanest view of the pathway maturing.
| Fiscal year | New agreements signed | Of which production | Production share of new agreements |
|---|---|---|---|
| FY2017 | 157 | 0 | 0.0% |
| FY2018 | 305 | 0 | 0.0% |
| FY2019 | 589 | 13 | 2.2% |
| FY2020 | 973 | 74 | 7.6% |
| FY2021 | 1,043 | 80 | 7.7% |
| FY2022 | 663 | 70 | 10.6% |
| FY2023 | 918 | 94 | 10.2% |
| FY2024 | 1,156 | 148 | 12.8% |
| FY2025 | 1,192 | 159 | 13.3% |
Anchoring on FY2019 — the first year production agreements existed at all, and safely clear of the record’s opening — new agreements roughly doubled by FY2025, while new production agreements went up twelvefold. The production share of new agreements rose from 2.2% to 13.3%.
That share is higher than the dollar share, which is worth noticing: production agreements are somewhat more numerous than they are expensive, relative to prototypes.
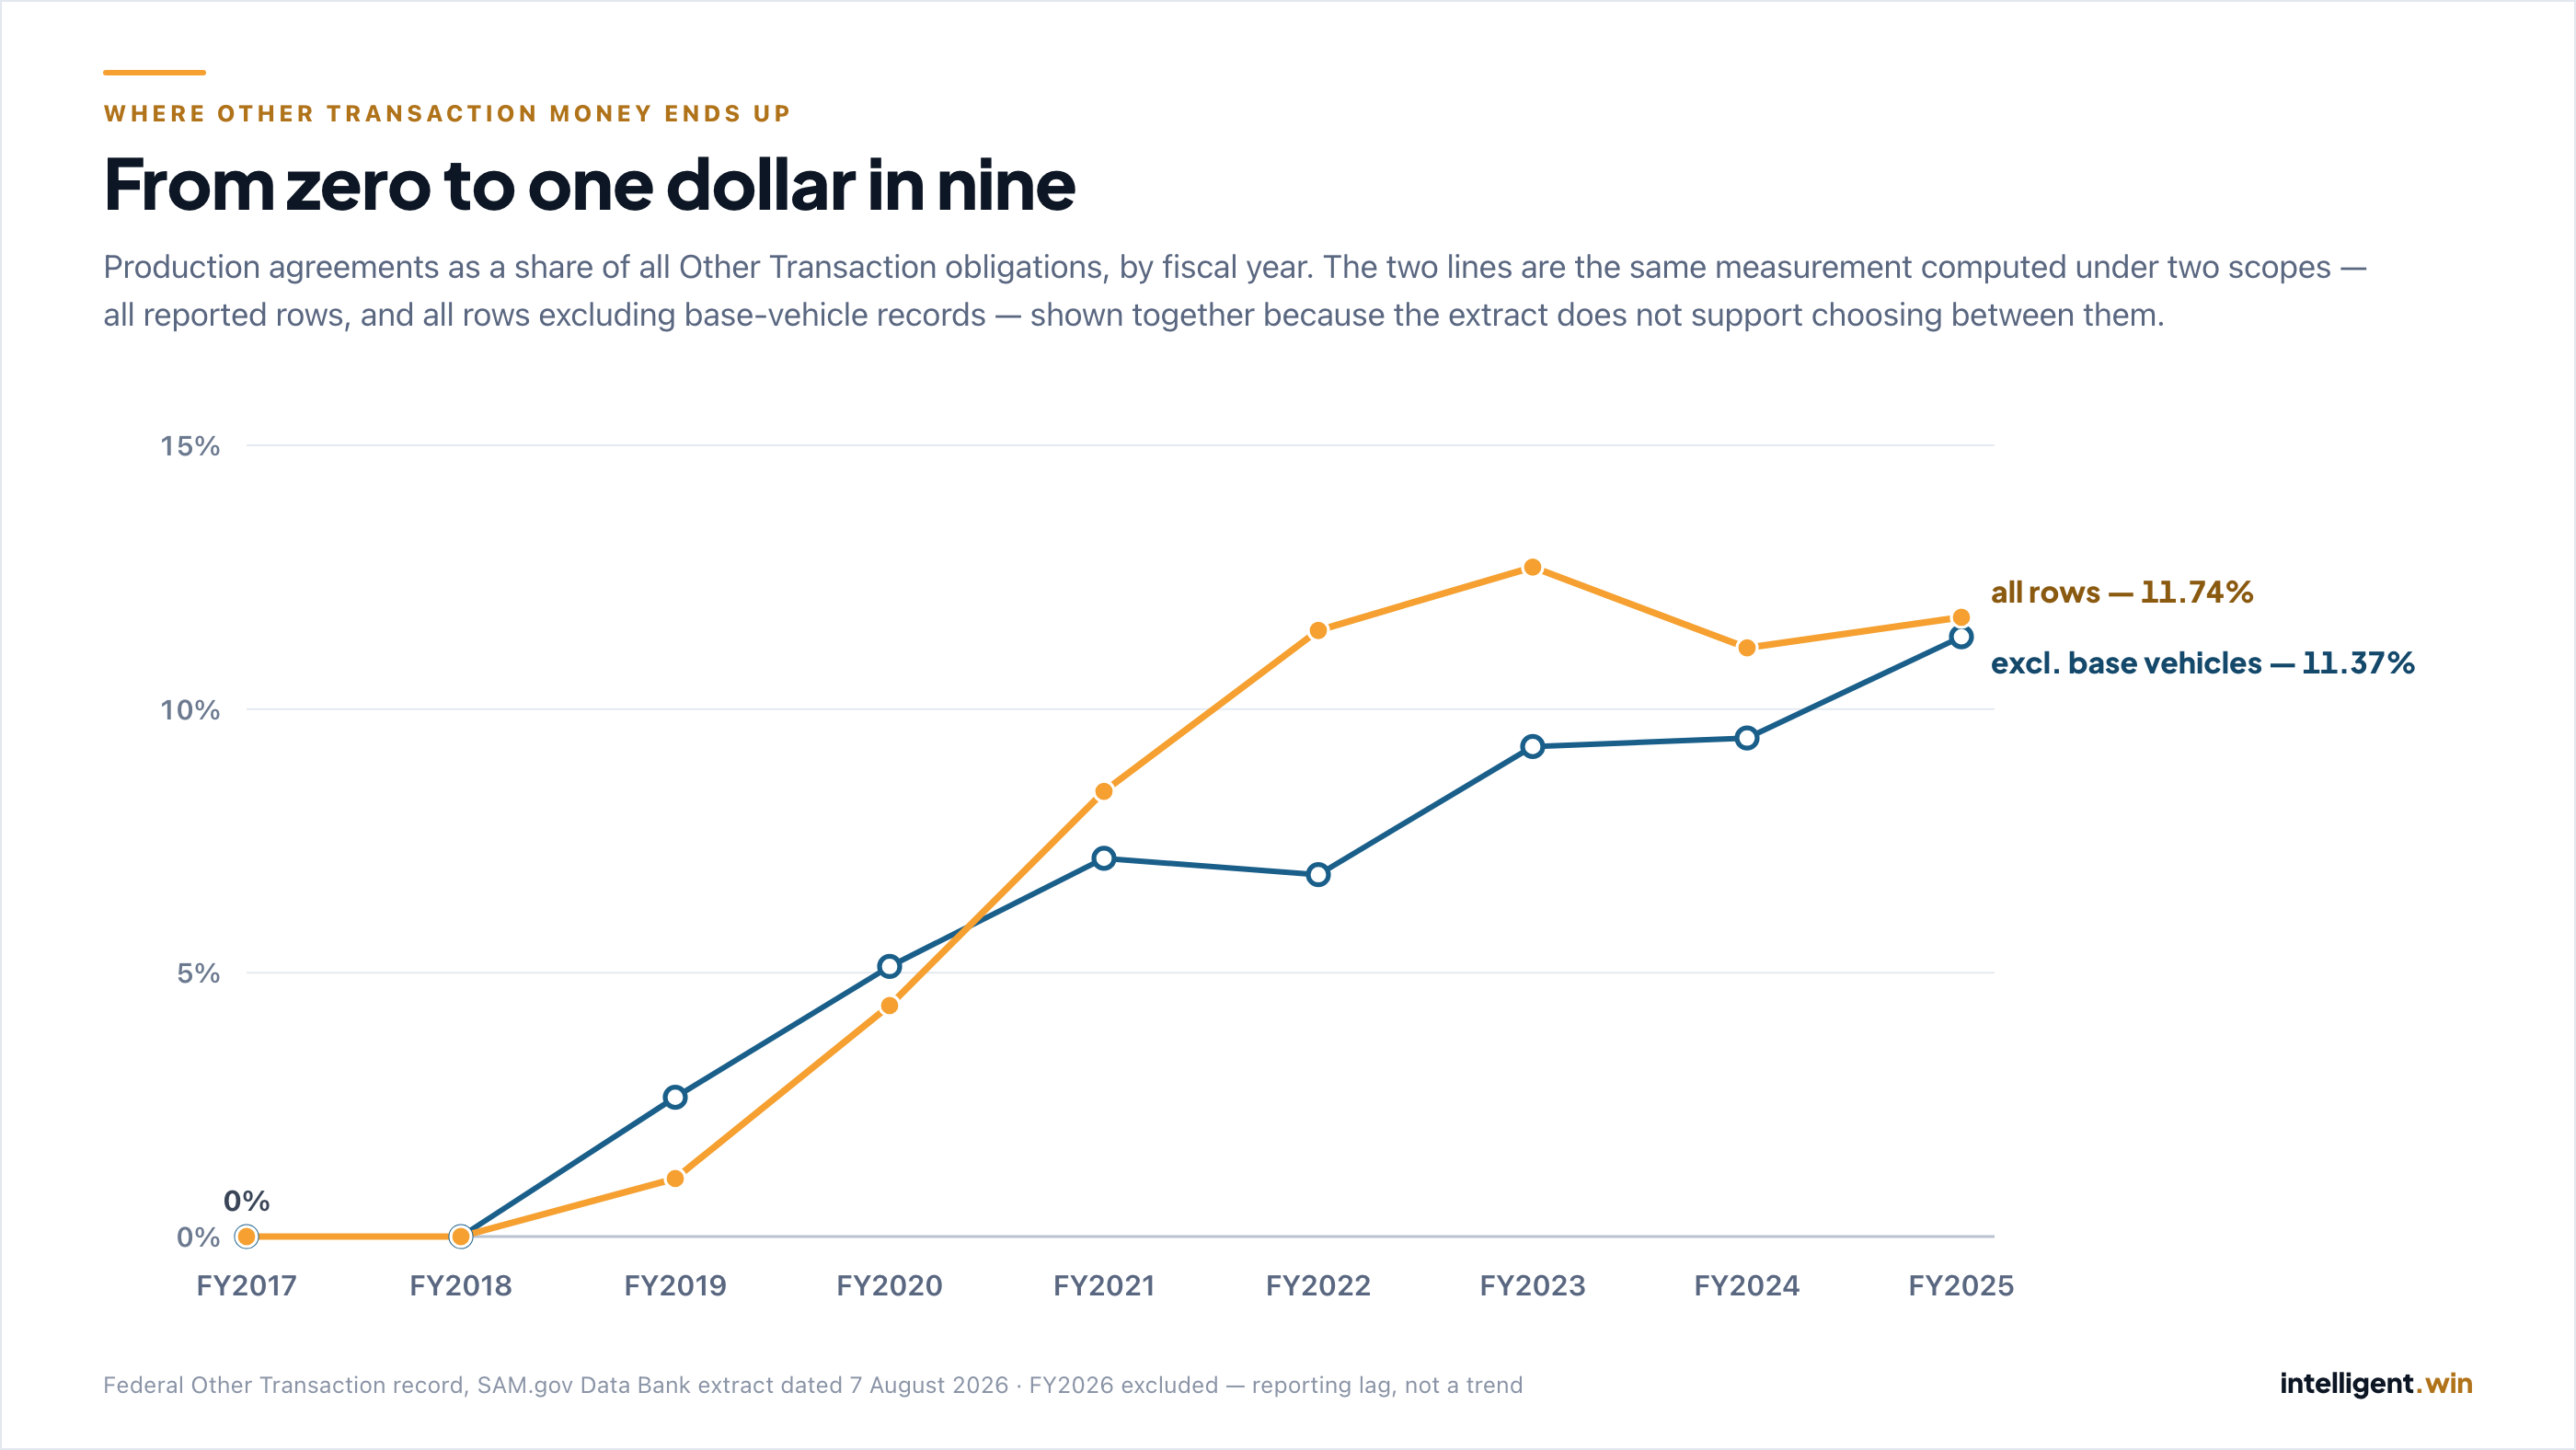
The dollar series is stable under one scope and still rising under the other — 12.7%, 11.2%, 11.7% across FY2023–25 counting all rows, against 9.3%, 9.5%, 11.4% excluding base vehicles. Both land in the same place; only one of them has flattened.
It means completely different things to different buyers
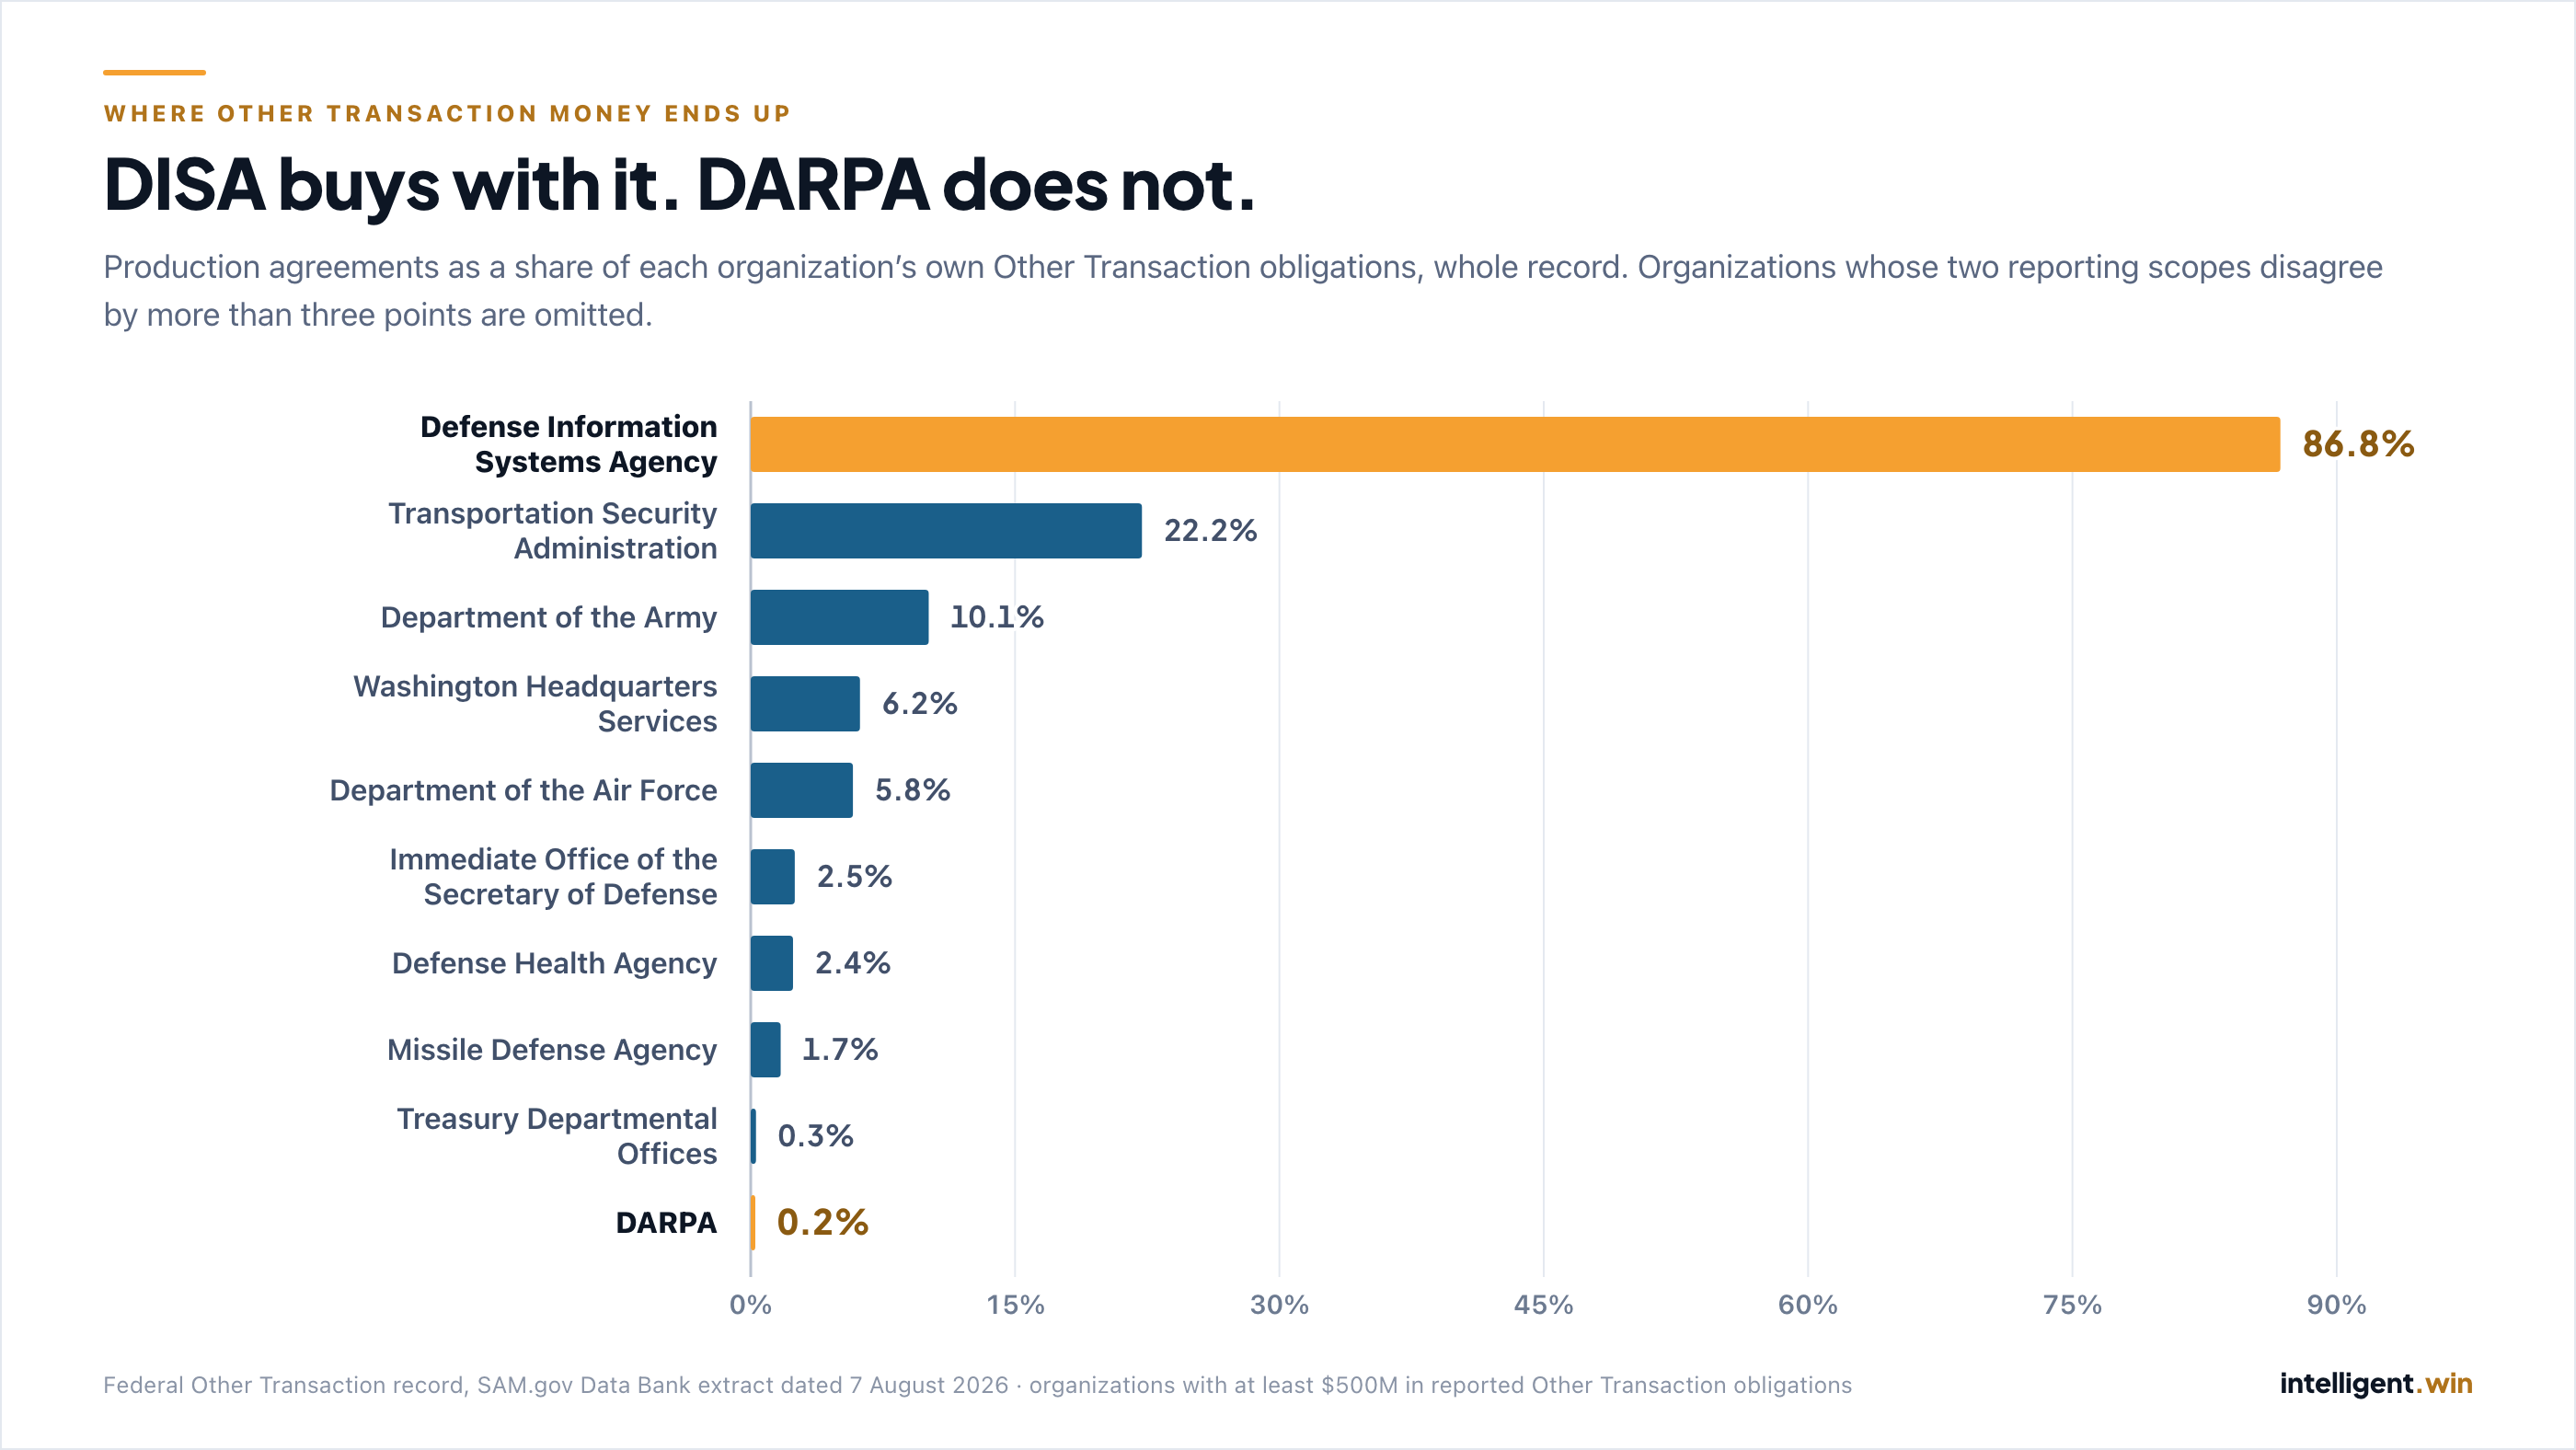
The government-wide share conceals an enormous spread. Some organizations use Other Transaction authority almost exclusively to prototype. Others use it mainly to buy.
| Buying organization | Production share (all rows) | Production share (excl. base vehicles) |
|---|---|---|
| Defense Information Systems Agency | 86.8% | 86.8% |
| Transportation Security Administration | 22.2% | 22.2% |
| Department of the Army | 10.1% | 10.8% |
| Washington Headquarters Services | 6.2% | 7.1% |
| Department of the Air Force | 5.8% | 5.9% |
| Immediate Office of the Secretary of Defense | 2.5% | 2.5% |
| Defense Health Agency | 2.4% | 2.4% |
| Missile Defense Agency | 1.7% | 0.0% |
| Treasury Departmental Offices | 0.3% | 0.3% |
| DARPA | 0.2% | 0.0% |
Whole record. Organizations below $500M in reported obligations are excluded, as are three whose two scopes disagree by more than three points.
DISA and DARPA are the two ends of the same authority. DARPA has obligated $5.81 billion through Other Transactions across 1,199 agreement numbers and has put essentially none of it into production agreements — which is what you would expect from an organization whose job ends at the demonstration. DISA has obligated far less overall and put the large majority of it into production.
Neither is a verdict on either organization. It is evidence that “the OT production share” is not one number that means one thing; it is a different number for every buyer, and knowing which kind of buyer you are talking to is the useful part.
Three organizations that clear the same size threshold are omitted because their two scopes disagree by more than three points — the Defense Counterintelligence and Security Agency (59.6% against 0.0%), U.S. Special Operations Command (38.7% against 11.0%) and the Department of the Navy (11.1% against 8.5%). Where a single figure cannot be stated honestly, none is.
The concentration is worth stating plainly: the Army is the largest single Other Transaction buyer by a wide margin — between 28% and 47% of reported obligations, depending on scope — and the three military departments together account for 78–80%.
This is a defense instrument with a civilian tail, not a government-wide one.
The competition question
The most common criticism of Other Transaction authority is that it is a way around competing work. Whatever was true early on, it is not what the current record shows.
| Fiscal year | Competed share, all rows | Competed share, excl. base vehicles |
|---|---|---|
| FY2017 | 40.2% | 71.9% |
| FY2019 | 75.2% | 79.7% |
| FY2021 | 79.0% | 83.2% |
| FY2023 | 87.1% | 86.9% |
| FY2025 | 87.6% | 90.0% |
The two scopes disagree sharply about FY2017 and converge as the record matures — so we make no precise claim about the starting point. The direction is not in question under either measurement: the competed share rose substantially and now sits between 87.6% and 90.0%.
Separately, 96.0% of prototype obligations in FY2024–FY2025 record significant nontraditional participation — the statutory condition most Other Transaction prototype awards rely on.
Two things that complicate it
The lag is real and it cuts in our favour, not against it. A production agreement follows the prototype that justified it by years, so a share measured today counts prototypes signed recently against production decisions made on prototypes signed long ago. The FY2025 figure of 11.4–11.7% is therefore a lower bound on where the current cohort will eventually land, not a finished verdict. It is also the reason the all-time 9.75% is the weakest number in this piece and the FY-by-FY series is the strongest.
The consortium picture is our attribution, not the government’s — and it does not survive a change of scope. This is the one table in this piece not drawn from a government field, so every figure below comes from our own derived attribution, and five of the nine rows rest on an inference that assigns a manager’s entire Other Transaction activity to the one consortium it is known to run. Worse for the reader, the ranking is not stable: sorted by all rows, AMTC leads at $8.03B; strip out the base-vehicle rows and C5 leads while MCDC falls from fifth to last, by three orders of magnitude, because 99.9% of MCDC’s figure is a single base-vehicle row. We publish both columns and the basis rather than pick one:
| Consortium | All rows | Excl. base vehicles | Attribution basis |
|---|---|---|---|
| C5 | $4.14B | $4.14B | agreement family |
| AMTC | $8.03B | $3.02B | agreement family |
| IWRP | $5.47B | $2.12B | ◆ manager inference |
| MTEC | $1.55B | $1.51B | ◆ manager inference |
| NAMC | $0.75B | $0.75B | ◆ manager inference |
| SOSSEC | $1.65B | $0.66B | ◆ manager inference |
| NSC | $0.52B | $0.51B | ◆ manager inference |
| TReX | $0.51B | $0.51B | agreement family |
| MCDC | $1.62B | $0.001B | agreement family |
◆ = attributed by manager inference: the whole of a manager’s activity assigned to the single consortium it is known to run. Treat those five as an upper bound on that consortium, not a measurement of it.
Only about a fifth of reported Other Transaction obligations resolve to a named consortium at all — roughly $24.5 billion, a figure that includes $225M for an inactive TReX predecessor not shown above; the remaining $93.4 billion is a mix of genuinely direct awards and agreements our attribution cannot assign. 98% of all production dollars sit in that unresolved bucket, which is why this piece does not attempt a per-consortium production split.
What it means
Stop quoting the all-time number. The 9.75% figure averages years in which production authority was effectively unused with years in which it was routine. The relevant number for anything happening now is the FY2025 one: roughly 11.4–11.7% of dollars, and 13.3% of newly signed agreements.
“Does this OTA lead to production?” is a question about the buyer, not the instrument. A DISA agreement and a DARPA agreement are the same legal authority used for opposite purposes. The buying organization’s own history is the single best predictor available, and it is public.
The competition assumption is out of date. If a capture strategy is built on the idea that Other Transaction work is largely uncompeted, the record has moved: roughly nine dollars in ten are recorded as competed, and have been for four years.
No one can publish a prototype-to-production conversion rate from this data, and be sceptical of anyone who does. The record links only 2% of production agreements back to a prototype base, and the agreement type never changes in place. A rate quoted from this source is an assertion the source cannot establish.
These numbers came out of the platform, not a spreadsheet.
The same contract corpus behind this note — 2.6 million contracts, reconciled against the government’s own published totals before anything publishes — is what the product runs on. If you want to see how it’s assembled and checked, that’s written up in full.