Market Note · 31 August 2026
Nine Percent of the Federal Services Year Happens in Seven Days
Federal services buying is not seasonal at the margins. It is concentrated into a single month, and half of that month lands in its final week — a pattern that has held in all six of the last completed fiscal years without a single exception. Here is the shape of it, who runs hardest into it, and what the government's own paperwork says about how the money goes out.
Intelligent Win · Market Intelligence — measured on intelligent.win’s contract corpus.
Across the six most recently completed fiscal years, September carried 17.97% of all federal services obligations — 2.16 times what an even month would hold. The figure has never dropped below 16.6% in any of those years.
Inside September, 49.8% of the money is obligated in the final seven calendar days. That range — 46.4% to 54.7% — has not been broken once in six years.
Put those together and you get the number worth remembering: roughly 9% of the entire fiscal year’s services obligations are placed in seven calendar days. Seven days is 1.9% of the calendar. That is 4.7 times the normal daily pace of federal services buying, sustained for a week, every year.
Six completed fiscal years, FY2020–FY2025. FY2026 is excluded from every average — it is not finished, and September has not happened.
This is not a forecast. It is the measured shape of six completed years, and we are publishing it four weeks before the seventh.
The shape of the year
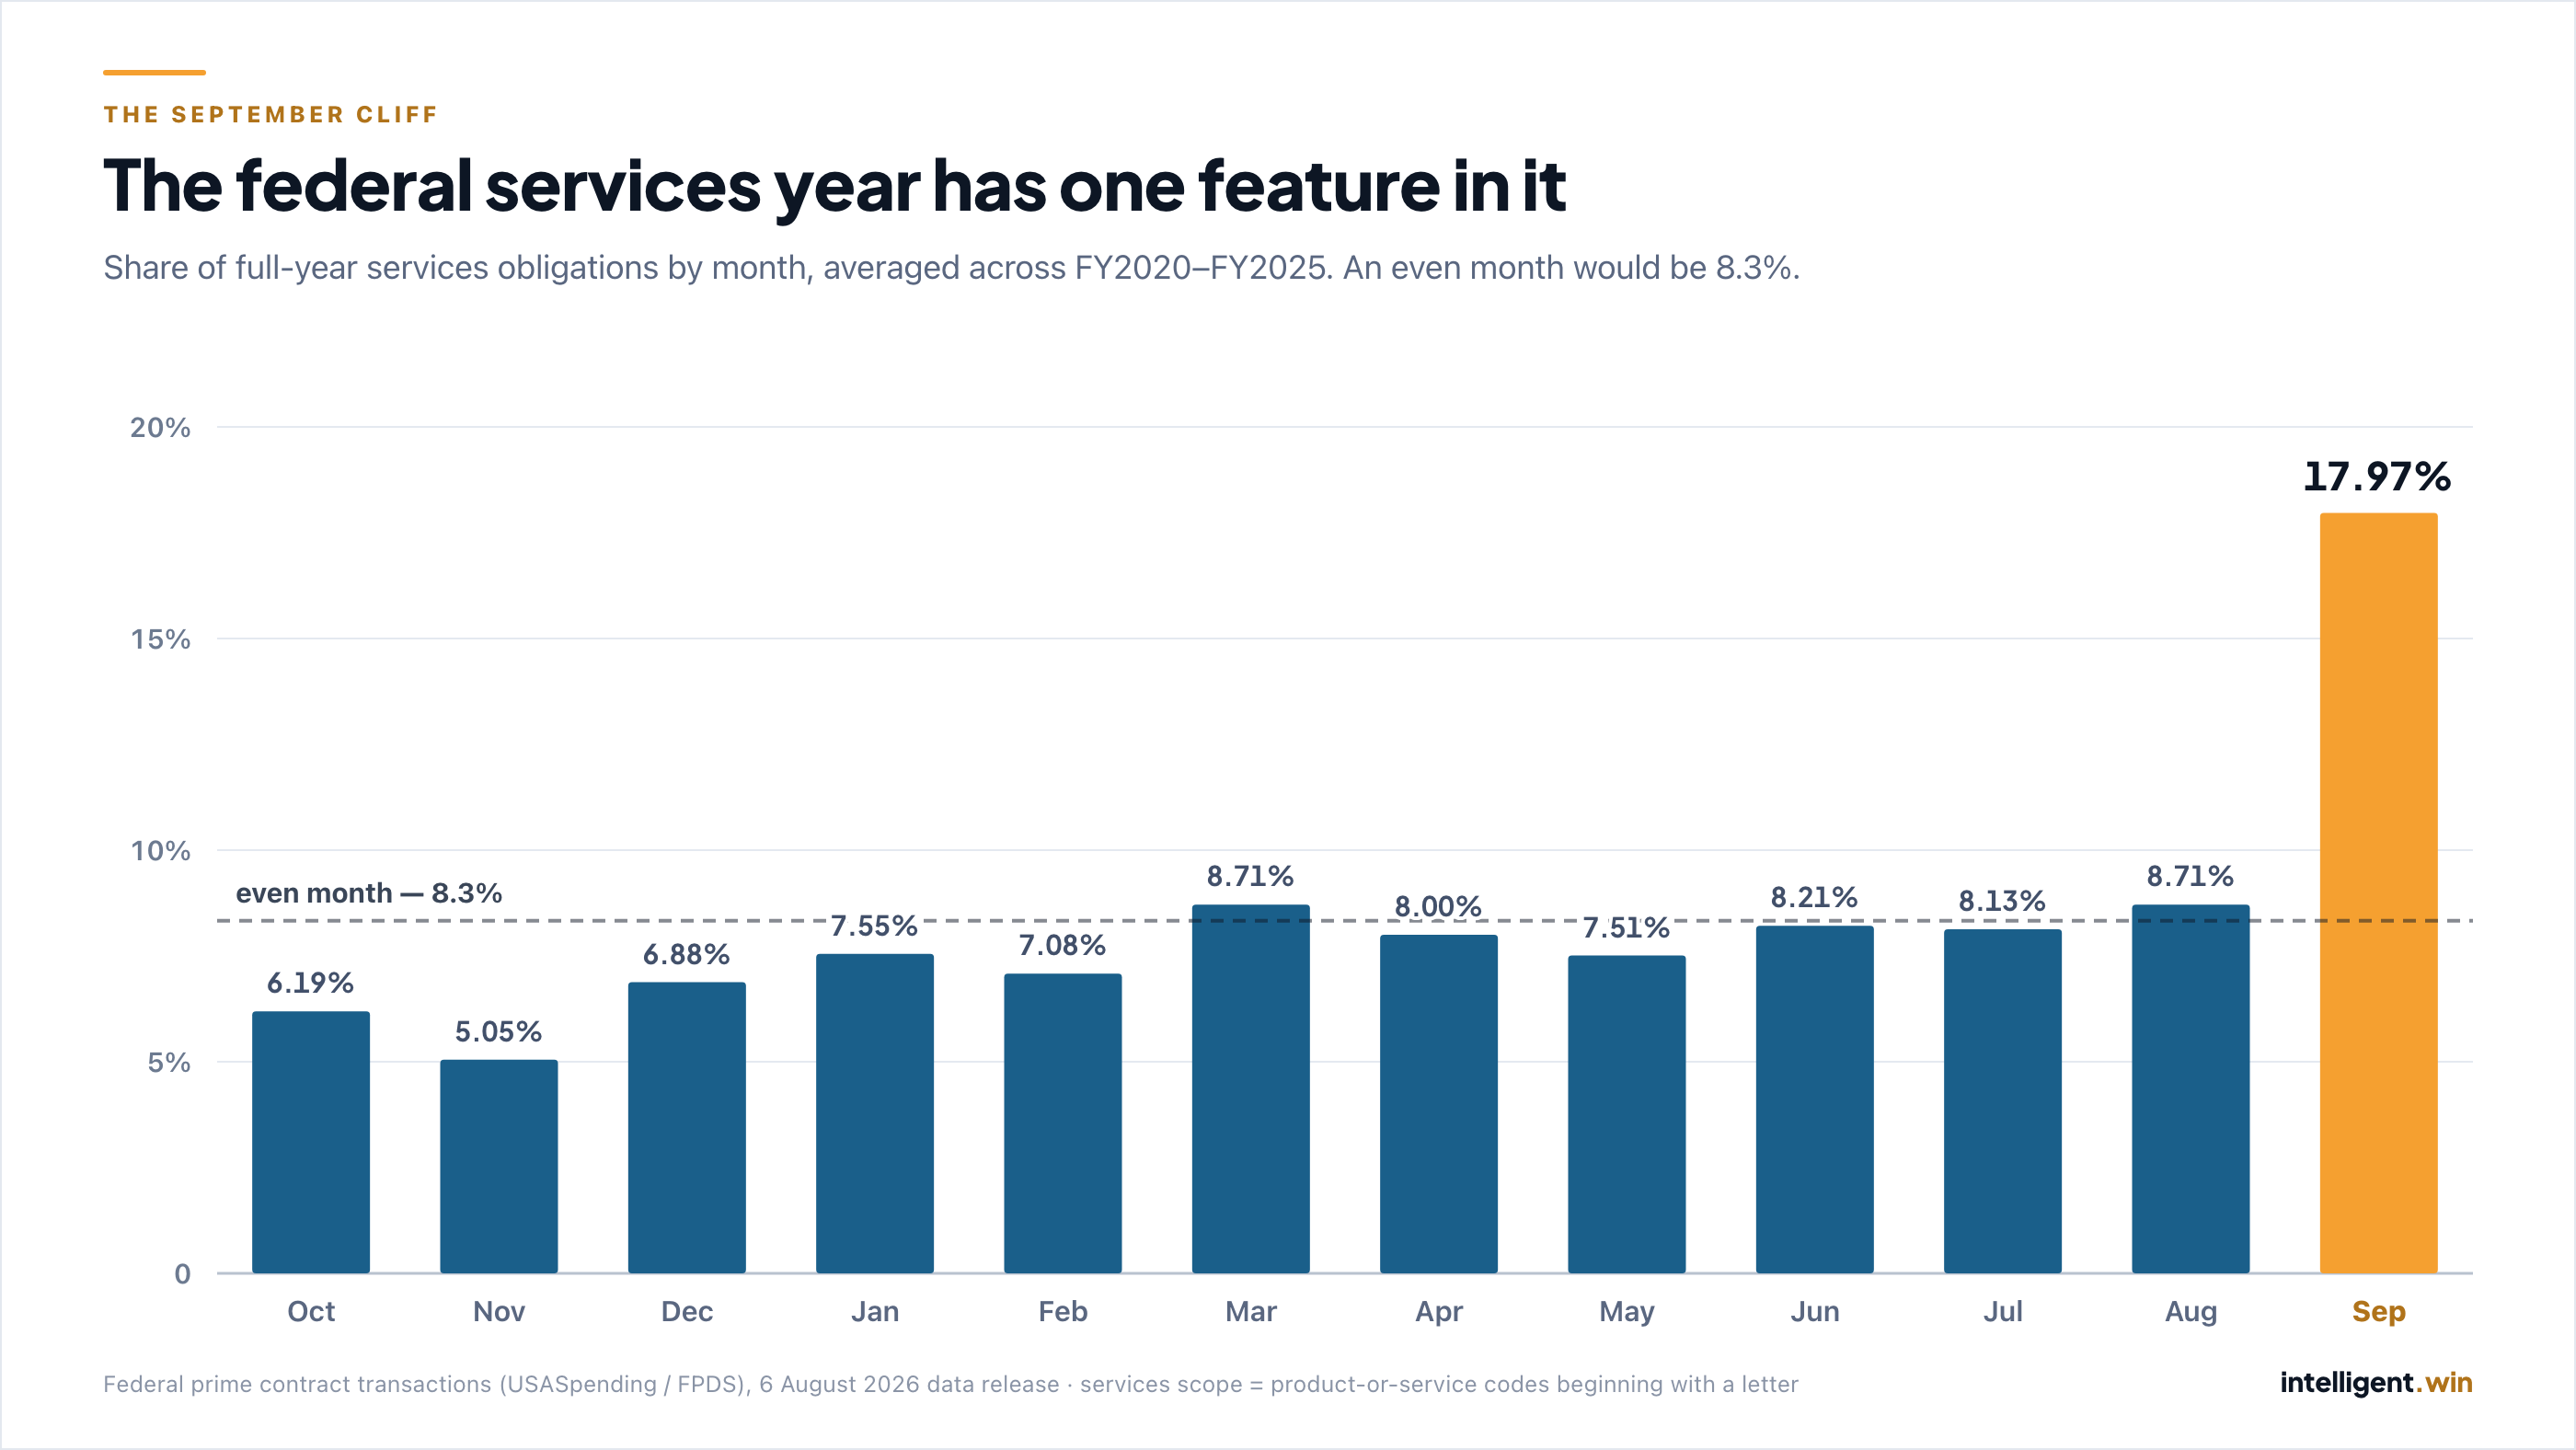
Grouping every services obligation by the month it was signed produces a year with one feature in it.
| Month | Share of FY services obligations (6-yr avg) |
|---|---|
| October | 6.19% |
| November | 5.05% |
| December | 6.88% |
| January | 7.55% |
| February | 7.08% |
| March | 8.71% |
| April | 8.00% |
| May | 7.51% |
| June | 8.21% |
| July | 8.13% |
| August | 8.71% |
| September | 17.97% |
Eleven months sit in a band between 5% and 8.7%. September sits at 18%. It is 3.6 times November, the quietest month of the year, and larger than any two other months combined.
The consistency is the part that makes it usable. Six years, six Septembers, and the share never left a four-point band:
| Fiscal year | September obligations | Share of that year |
|---|---|---|
| FY2020 | $71.2B | 18.02% |
| FY2021 | $71.6B | 17.88% |
| FY2022 | $88.5B | 20.34% |
| FY2023 | $84.3B | 17.65% |
| FY2024 | $82.5B | 16.61% |
| FY2025 | $84.4B | 17.33% |
Half of it lands in one week
The month-level number understates what actually happens, because September is not a busy month evenly. It is a ramp that ends in a wall.
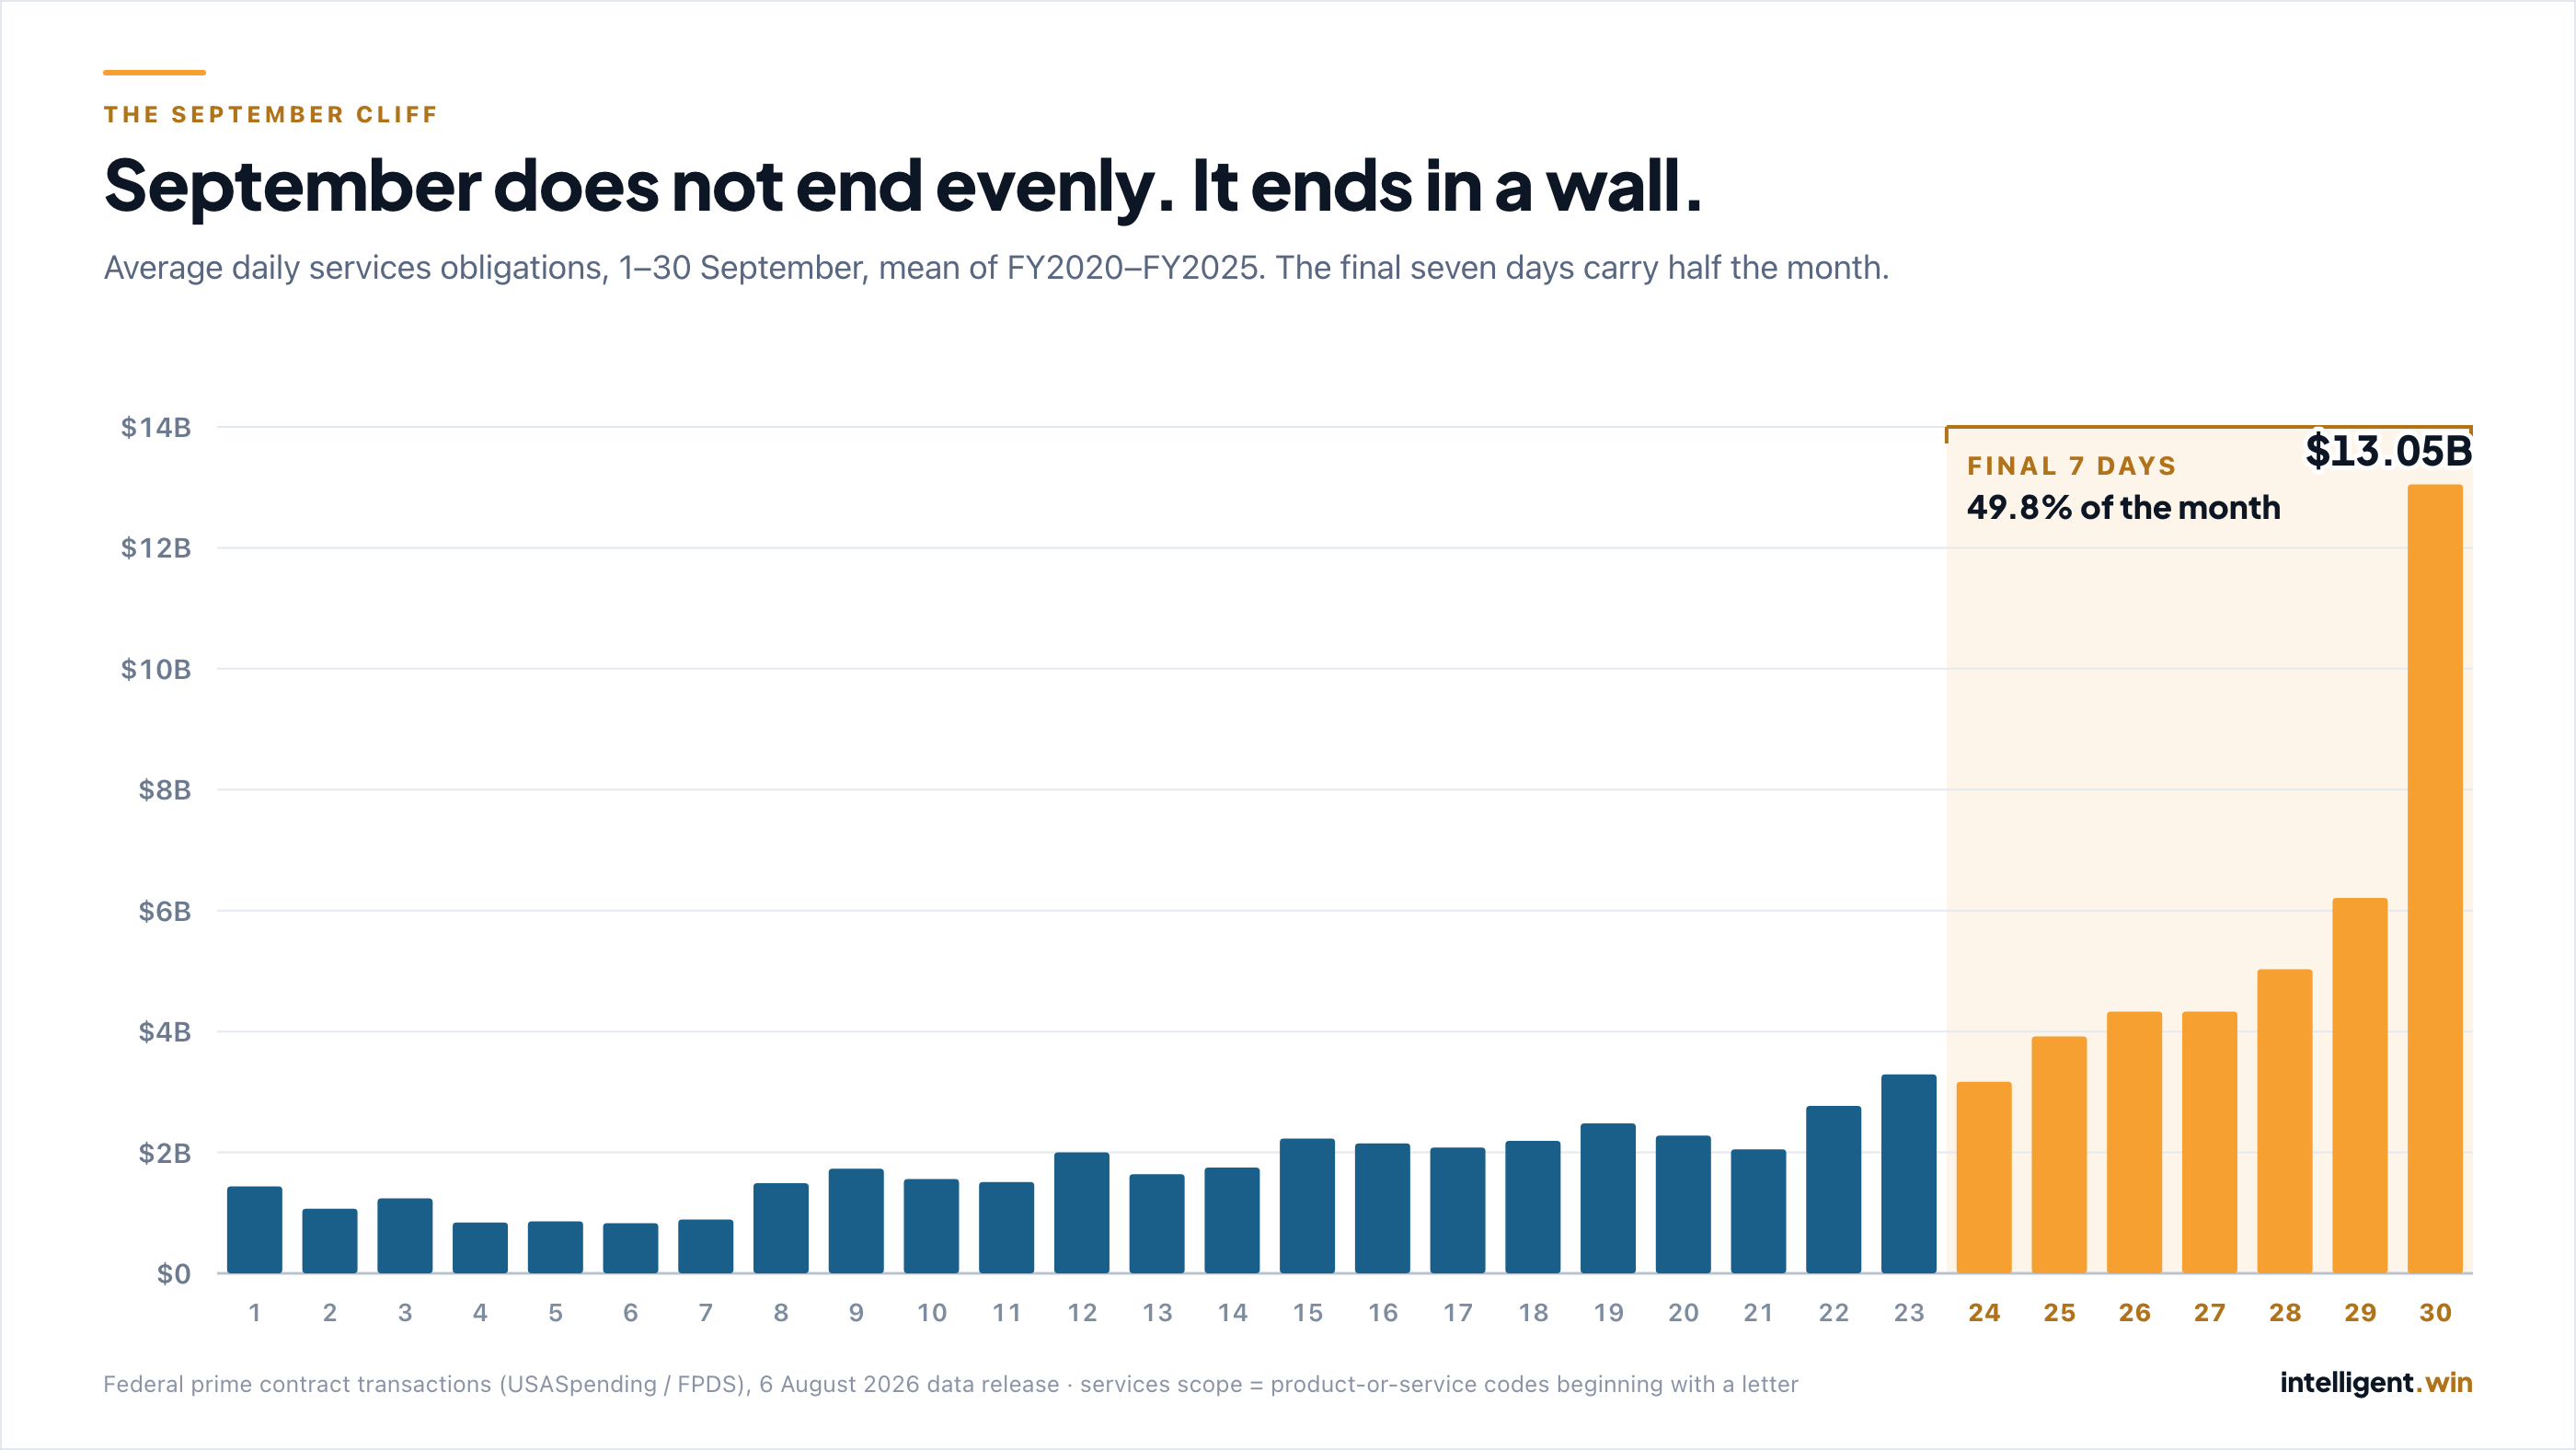
On a quiet early-September day, the government obligates about $0.83B in services. On 30 September, it obligates $13.05B — a fifteen-fold difference inside the same month, and 10.6 times an average day of the federal year.
The final seven days carry 49.8% of the month:
| Fiscal year | Sept total | Final 7 days | Share of September |
|---|---|---|---|
| FY2020 | $71.2B | $38.1B | 53.6% |
| FY2021 | $71.6B | $35.6B | 49.7% |
| FY2022 | $88.5B | $48.4B | 54.7% |
| FY2023 | $84.3B | $39.5B | 46.9% |
| FY2024 | $82.5B | $39.5B | 47.8% |
| FY2025 | $84.4B | $39.2B | 46.4% |
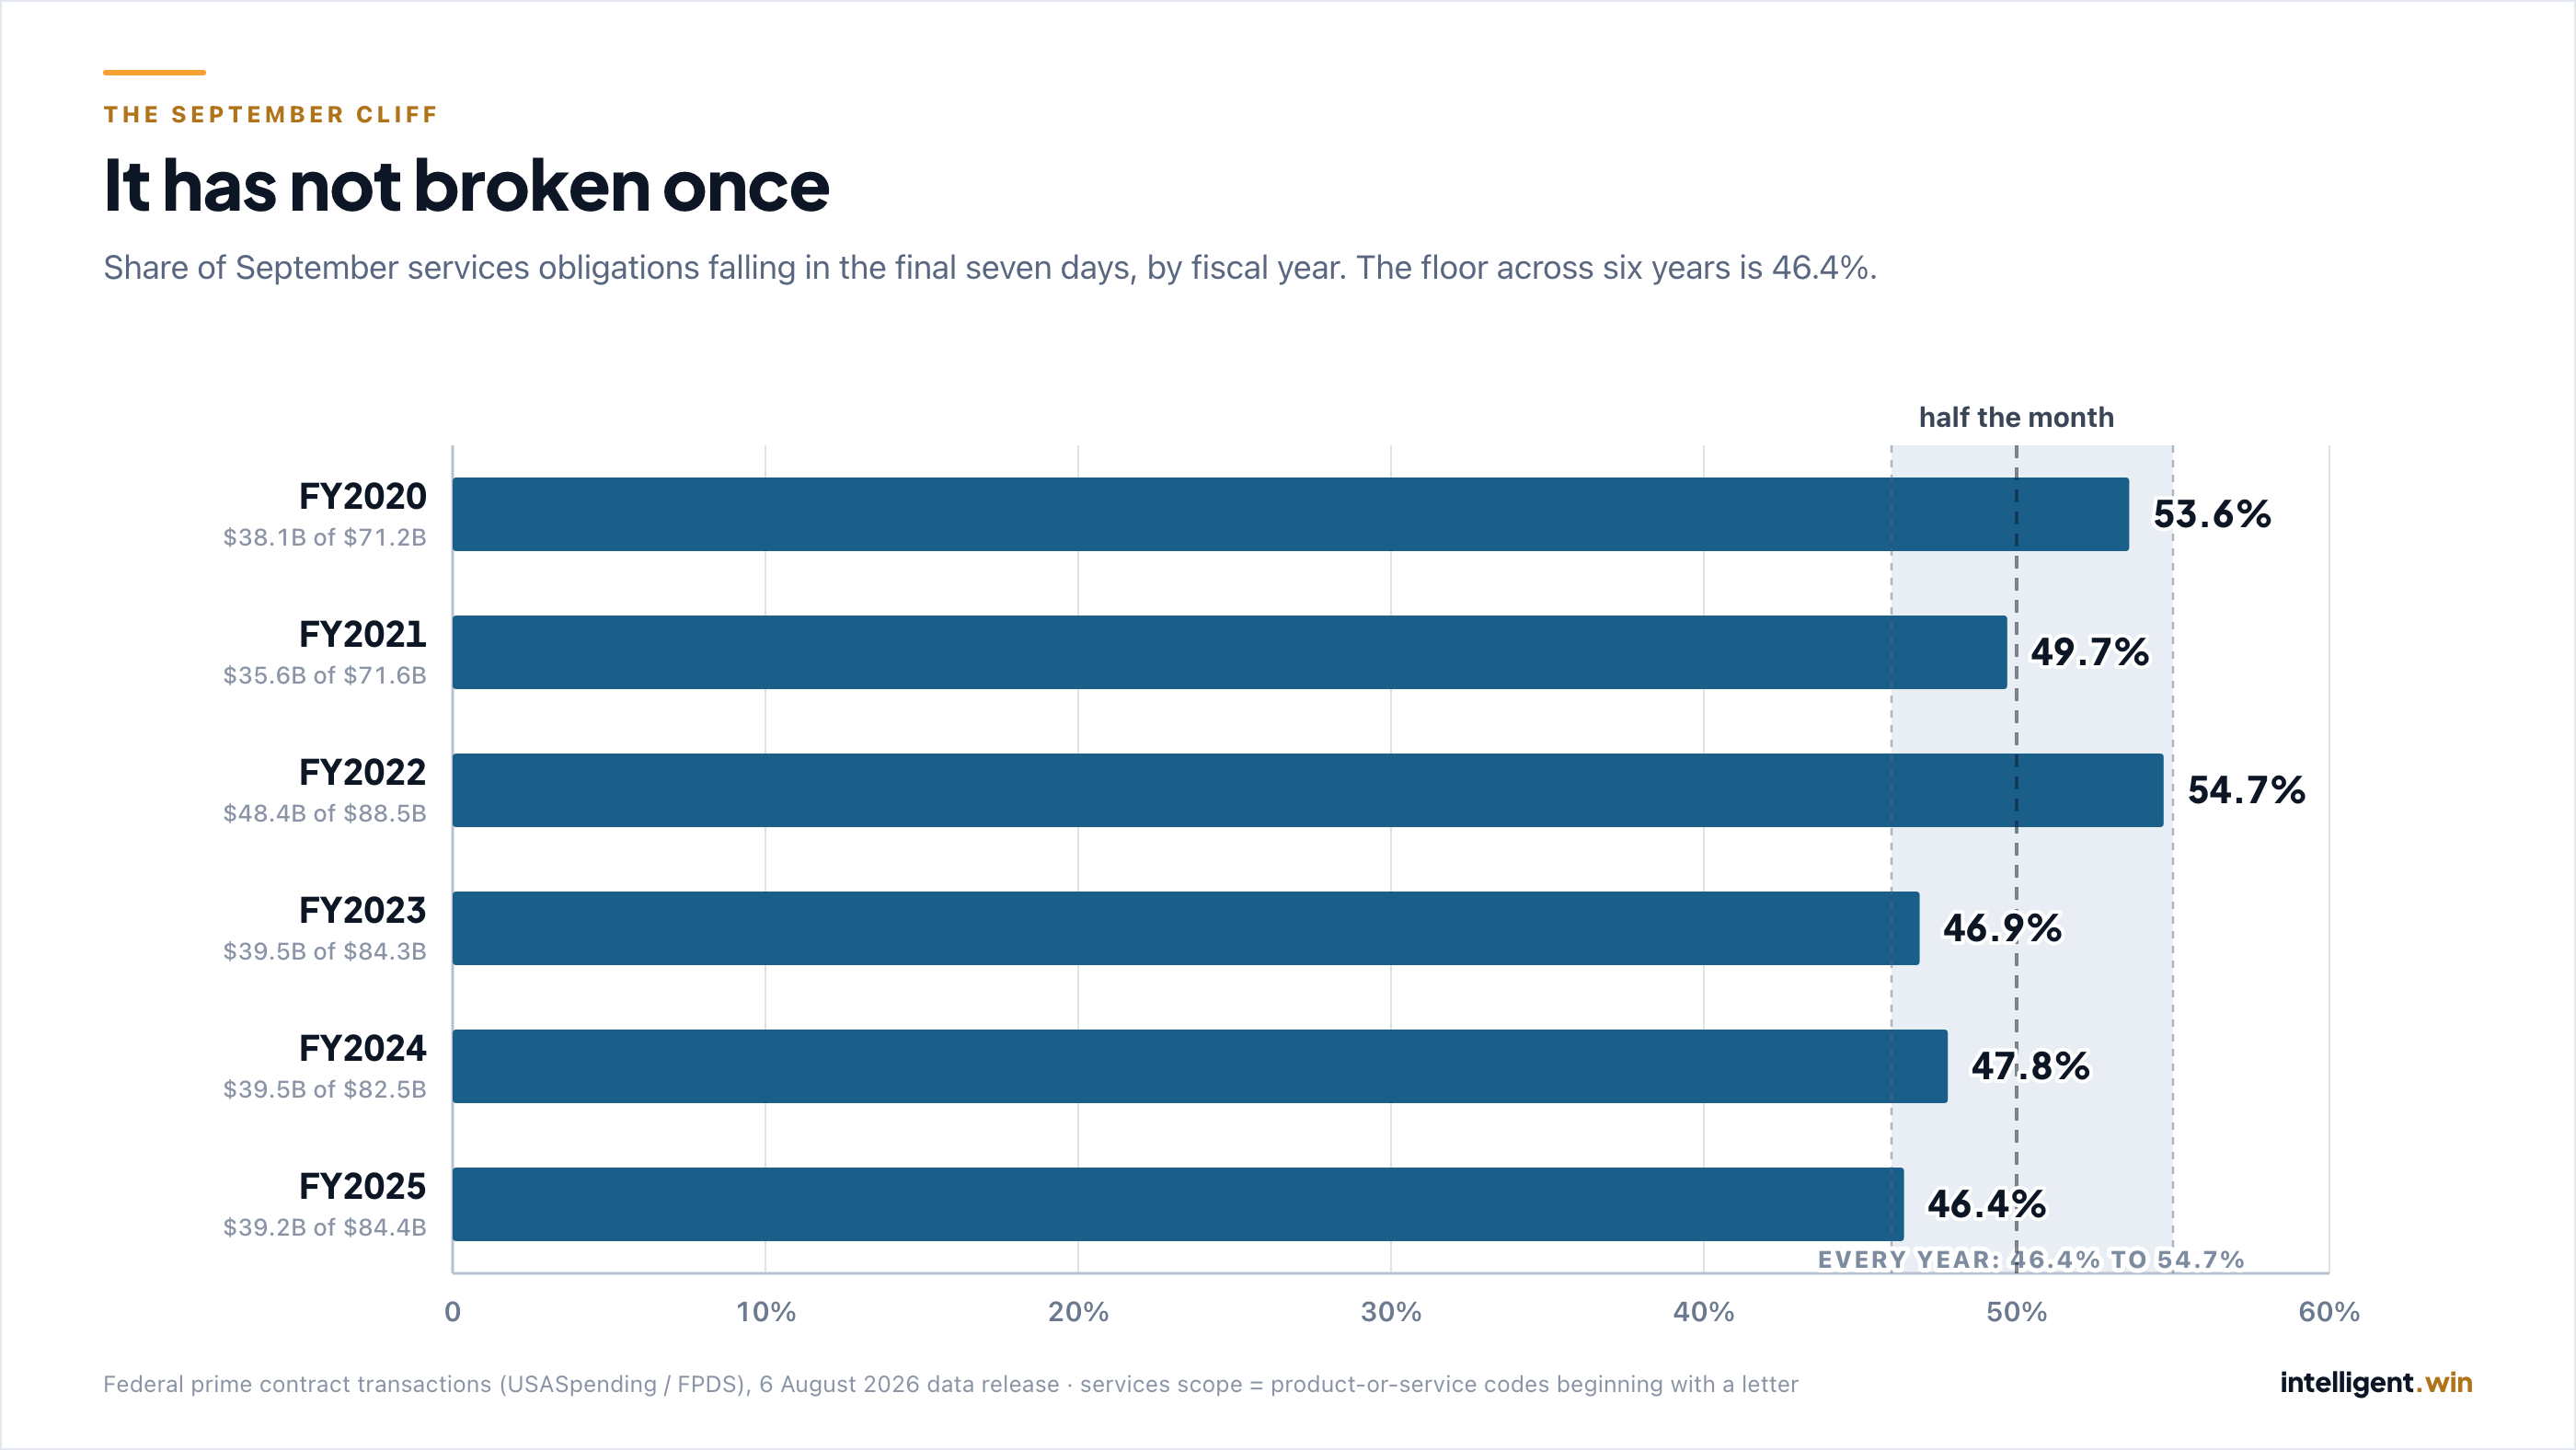
Six years, and the floor is 46.4%. Whatever else changes between administrations, budget cycles, and continuing resolutions, roughly half of September’s services money has moved in its last week every single time.
Measured against the whole year rather than the month, that week is 8.98% of annual services obligations — $39.2B of $487.3B in FY2025, on 39,529 of 644,331 distinct contracts.
Who runs into it hardest
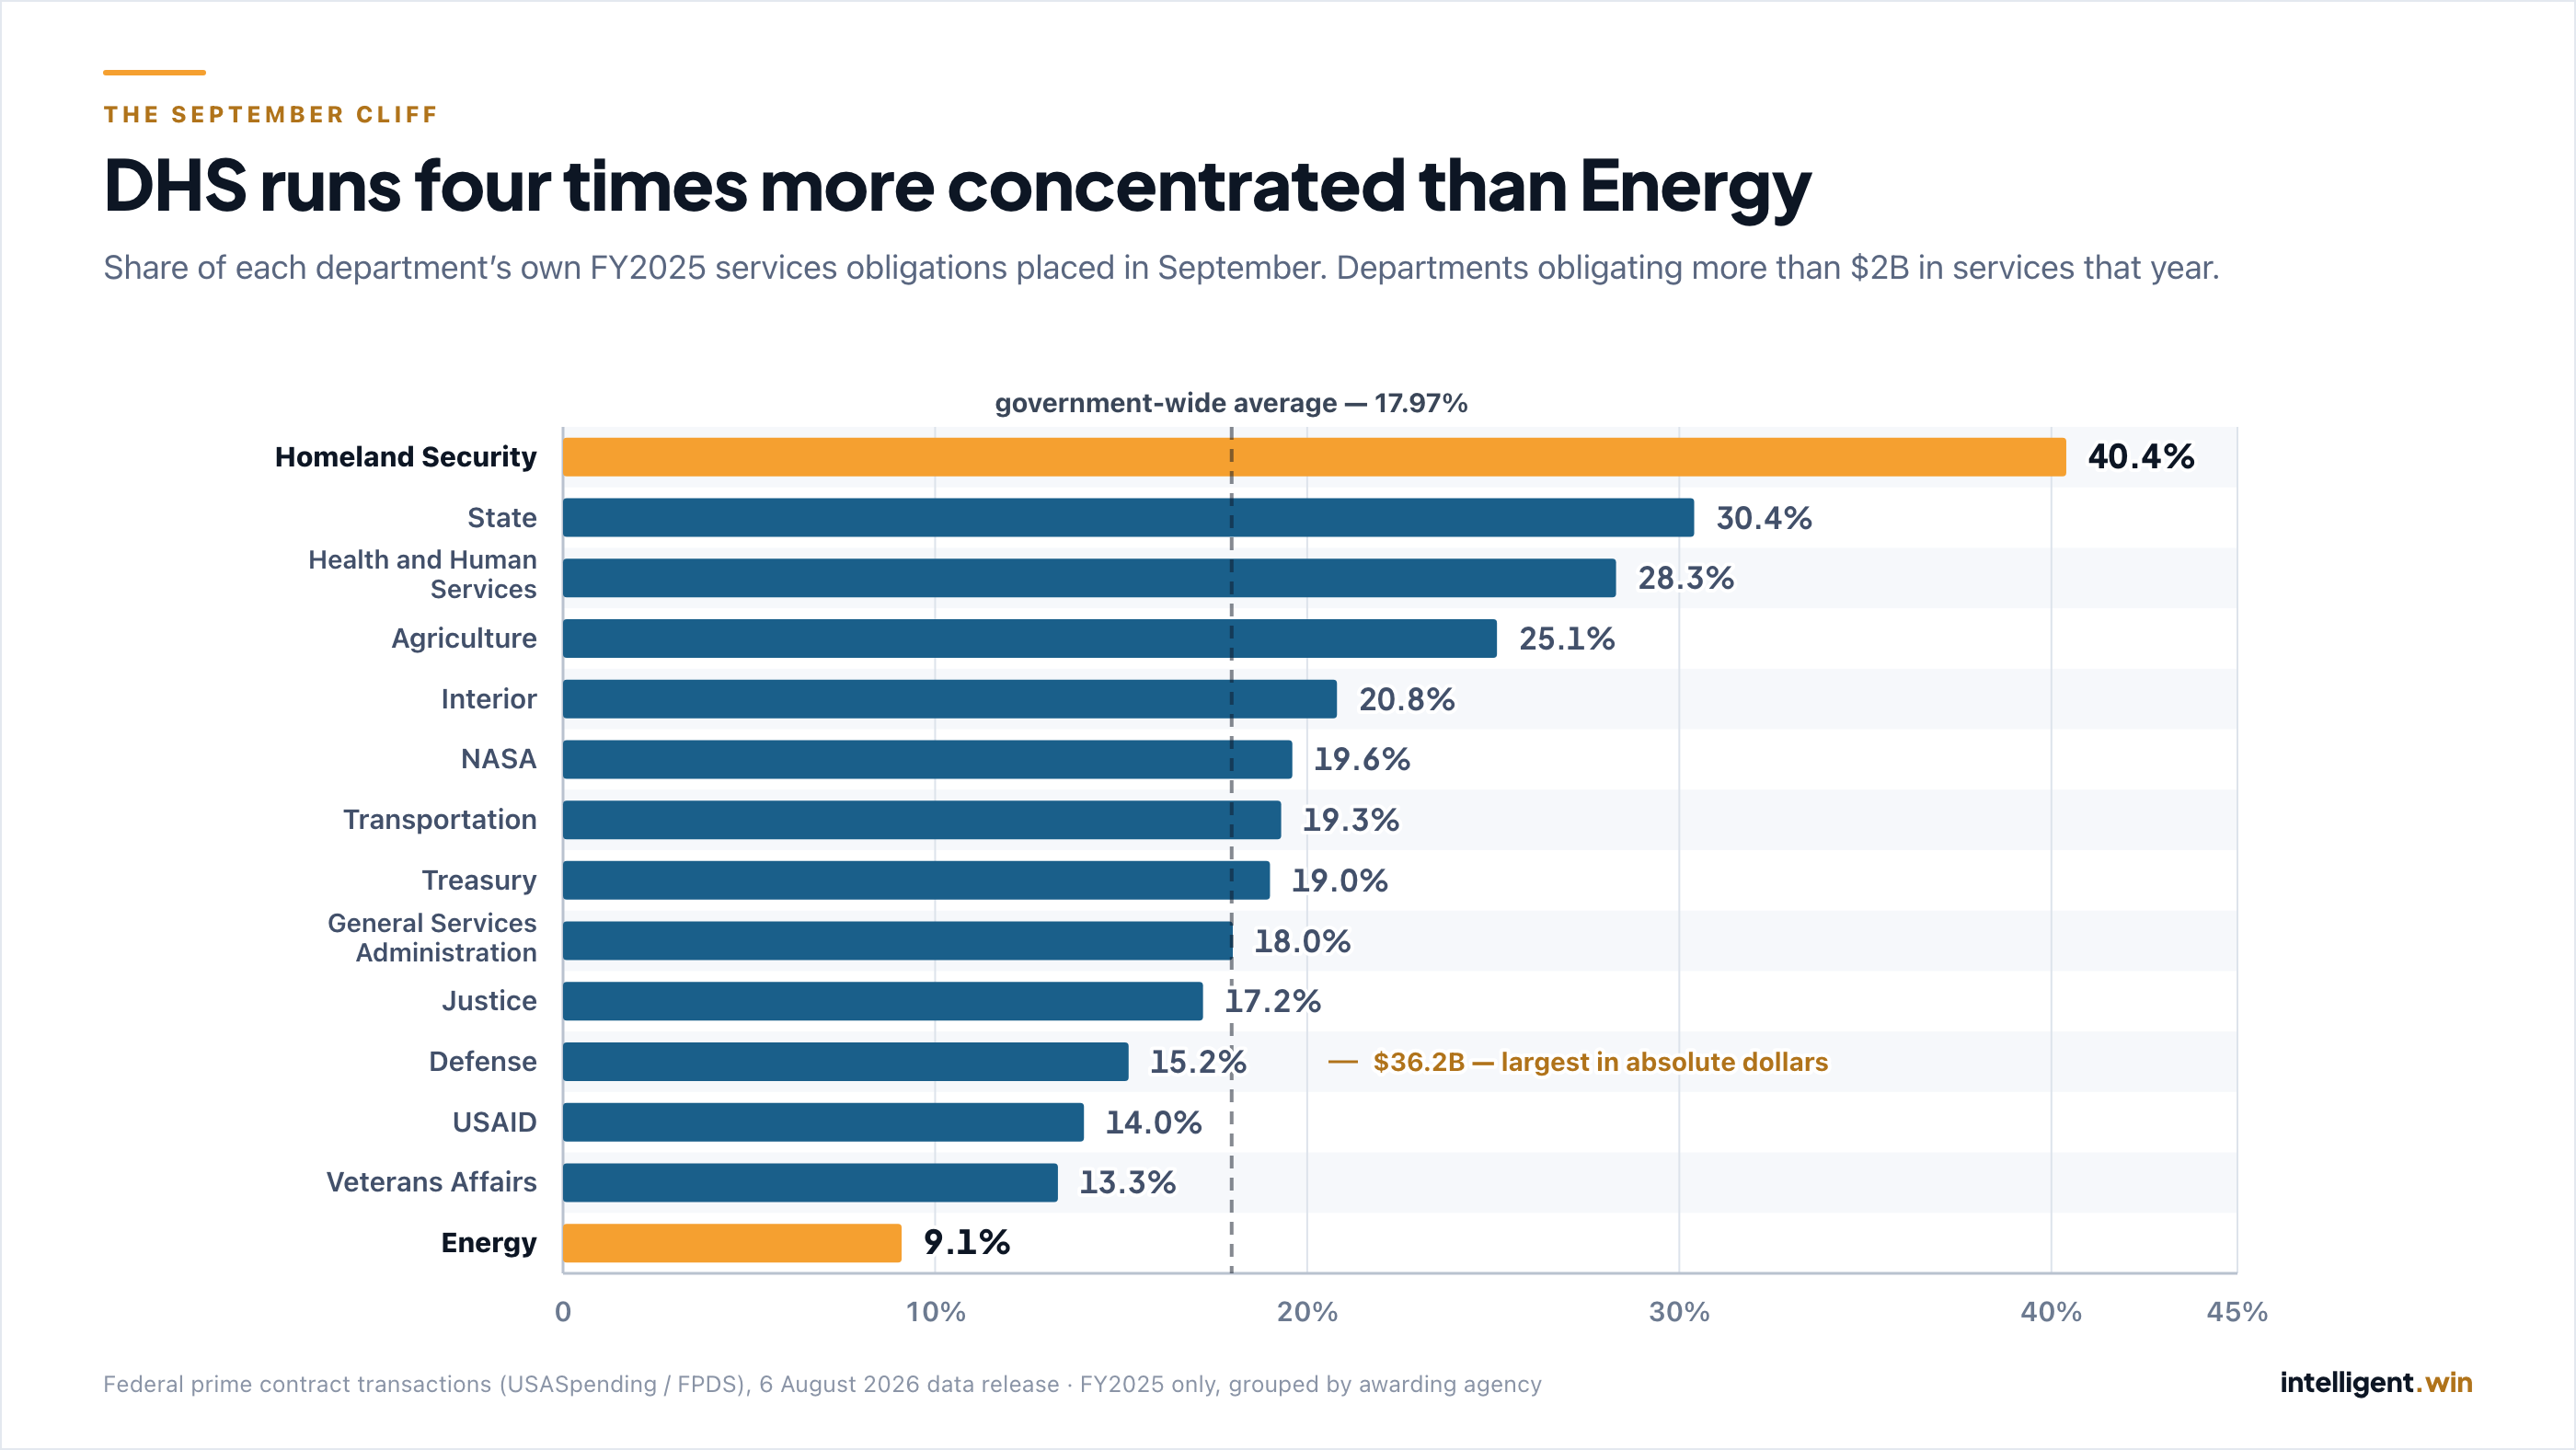
The government-wide average conceals a very wide spread. Some buyers are structurally year-end-driven; others barely notice the date.
| Department (FY2025 services) | September share of its own year | September / full year |
|---|---|---|
| Homeland Security | 40.4% | $9.7B / $24.0B |
| State | 30.4% | $2.6B / $8.4B |
| Health and Human Services | 28.3% | $5.3B / $18.8B |
| Agriculture | 25.1% | $1.3B / $5.1B |
| Interior | 20.8% | $1.2B / $6.0B |
| NASA | 19.6% | $3.8B / $19.3B |
| Transportation | 19.3% | $1.6B / $8.4B |
| Treasury | 19.0% | $0.9B / $4.9B |
| General Services Administration | 18.0% | $3.6B / $20.2B |
| Justice | 17.2% | $1.2B / $6.8B |
| Defense | 15.2% | $36.2B / $238.0B |
| USAID | 14.0% | $0.6B / $4.0B |
| Veterans Affairs | 13.3% | $8.1B / $61.2B |
| Energy | 9.1% | $4.5B / $49.7B |
FY2025 only, limited to departments obligating more than $2B in services that year, grouped by awarding agency.
DHS puts more than four times the proportion of its year into September that Energy does. Two departments of broadly comparable scale — Energy at $49.7B and VA at $61.2B — both sit near the bottom, while DHS at less than half their size runs the most concentrated year-end in government.
Worth noting what the percentages hide: DoD’s 15.2% is a below-average share, but at $36.2B it is by a wide margin the largest September in absolute dollars — 43% of all services money obligated government-wide that month.
A low share of a very large number is still the biggest single event on the calendar.
What the paperwork says
The obligation data tells you money moved. A second, entirely independent source tells you something about how.
When an agency awards without full and open competition, it must post a justification. Those filings are public, and they have their own seasonality:
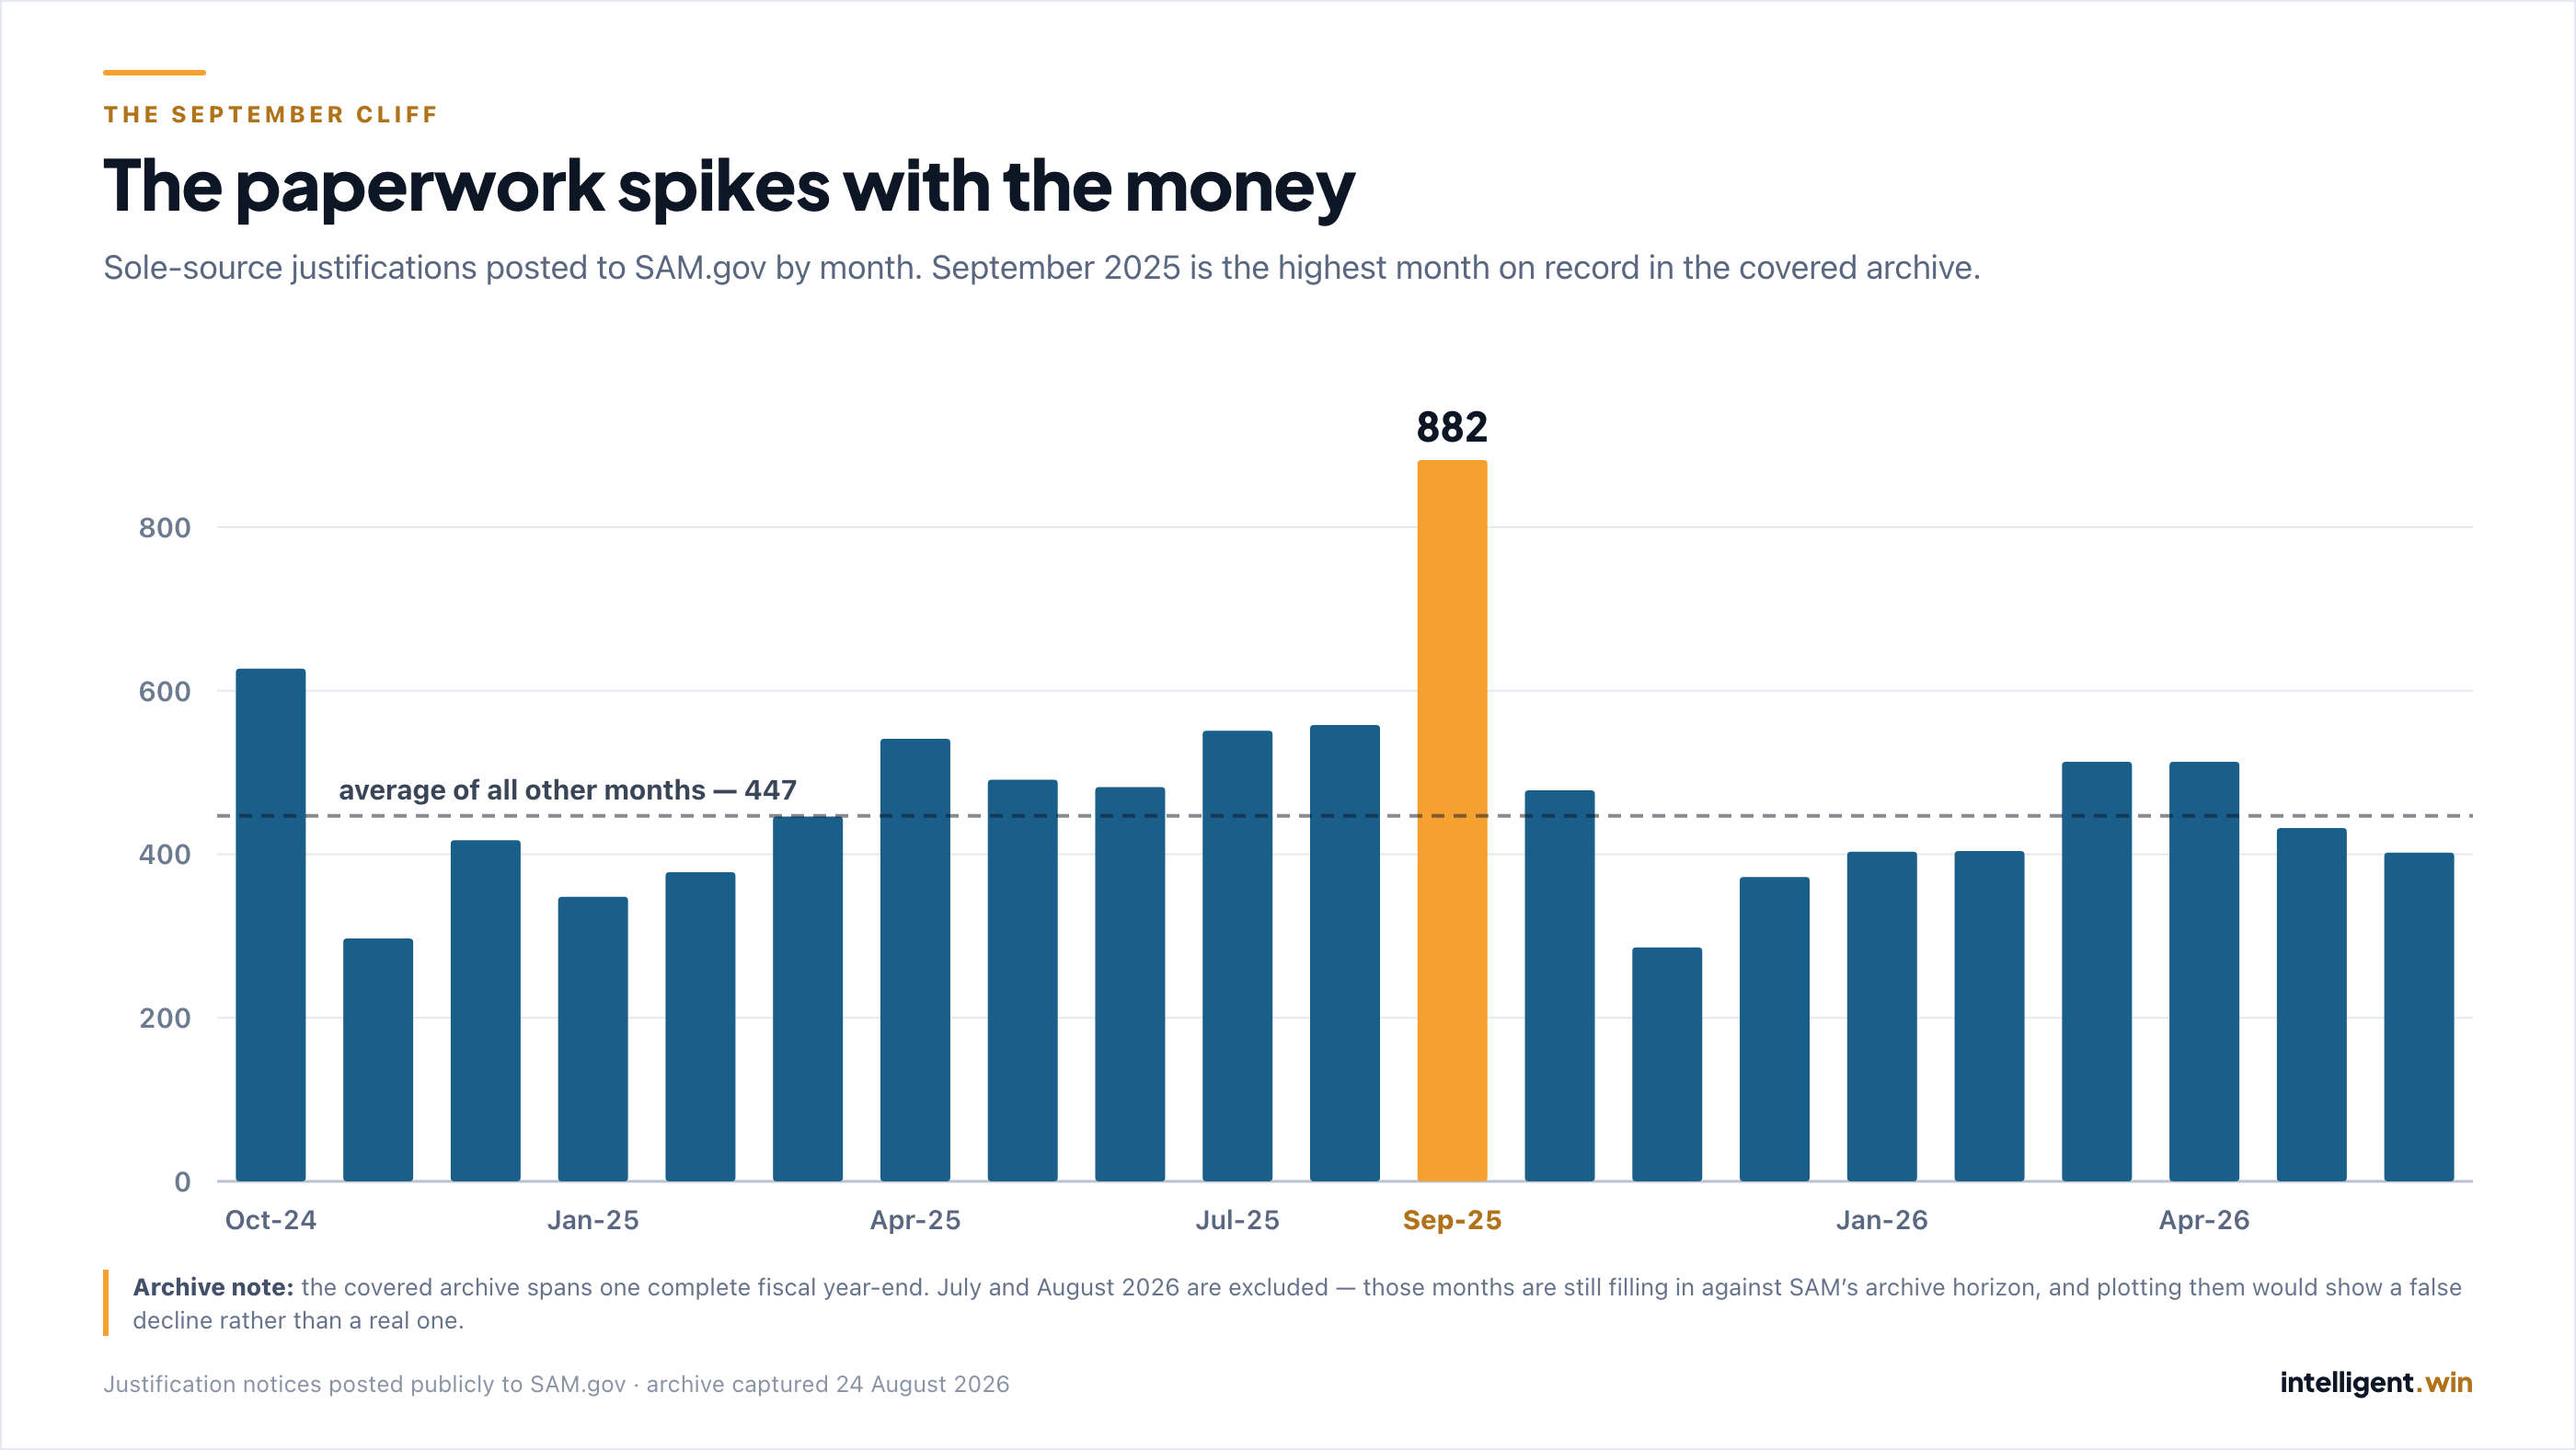
September 2025 produced 882 sole-source justifications — the single highest month in the archive, against an average of 447 across every other covered month. That is 1.97 times the normal rate, and 1.41 times the next-busiest month on record.
The money surge and the no-time-to-compete surge are the same event, showing up in two datasets that have nothing to do with each other. One is contract obligations reported to the federal spending system; the other is justification notices posted to SAM. Neither knows about the other. Both spike in the same month.
Two things that complicate it
It is a volume event more than a size event. September takes 19.67% of the year’s distinct services contracts but only 17.97% of the dollars. The average September award is smaller than the average award the rest of the year — in FY2025, $676,399 against $775,405, about 13% below the run rate, and September came in below its own year’s average in five of the six years measured. This is not primarily a story about giant year-end awards. It is a story about a very large number of ordinary ones clearing at once.
The final-week concentration is drifting down, slightly. The six-year sequence runs 53.6%, 49.7%, 54.7%, 46.9%, 47.8%, 46.4%. The three most recent years are the three lowest. That is a real pattern in a short series and we are not going to over-read it — the floor is still 46.4%, and the direction may reverse next month. But anyone modelling this year should probably anchor nearer the recent 46–48% than the six-year 49.8%.
One limitation worth stating plainly: this analysis counts obligations and contracts, not vendors. It supports no claim about how many companies are on the receiving end, or how that has changed.
What it means four weeks out
The dynamics the numbers describe, without embellishment:
The window is not September. It is the last week of September. Half the month’s money moves after the 24th. Work that is positioned by mid-month is positioned for the part of the month that matters; work that surfaces on the 28th is arriving into the busiest procurement week of the federal year.
Your customer’s calendar is not the government’s calendar. A 40% year-end buyer and a 9% year-end buyer are running different businesses on the same fiscal clock. The department table above is the fastest way to know which one you are dealing with — and DHS, State, and HHS behave very differently in September from Energy, VA, and USAID.
The J&A signal is the one to watch in real time. Sole-source justifications nearly double in September. Those are public filings, posted as they happen, and each one is a statement that an agency has decided it does not have time to compete something. They are the leading edge of the same wave the obligation data only confirms months later.
Most of what clears is ordinary-sized. The average September action is smaller than the average action the rest of the year. The year-end flush is broad, not top-heavy — which is a different opportunity profile than the “everyone chases the same mega-award” framing usually applied to it.
We will check our own work in October
The September obligation data lands in the federal release that follows the month’s close. When it does, we will publish the other half of this piece: what actually moved.
The testable claims, on the record, before the fact:
- September 2026 services obligations land between 16.6% and 20.3% of the fiscal year — the six-year observed range.
- At least 46% of September’s services obligations fall on 24–30 September.
- 30 September alone carries the largest single-day services obligation total of FY2026.
- September 2026 produces more sole-source justifications than any other month of FY2026.
If any of those break, that is the more interesting story, and we will write that one instead.
These numbers came out of the platform, not a spreadsheet.
The same contract corpus behind this note — 2.6 million contracts, reconciled against the government’s own published totals before anything publishes — is what the product runs on. If you want to see how it’s assembled and checked, that’s written up in full.