Market Note · 19 October 2026
GSA Schedule Orders Fell by Nearly Half Since FY2021. The Dollars Rose 18%.
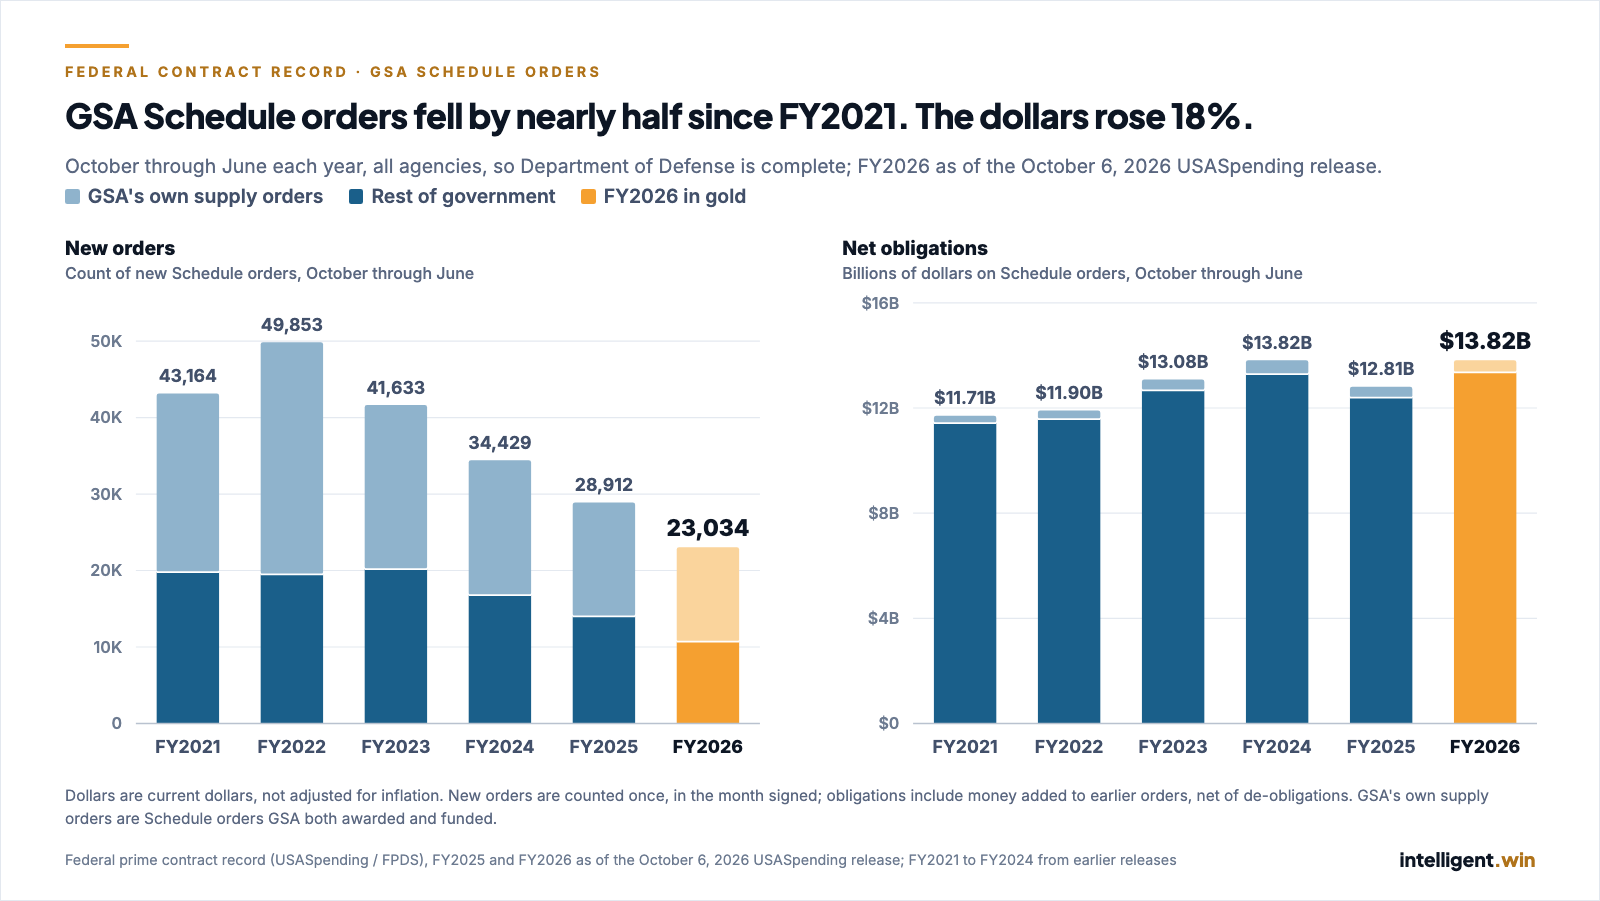
From October through June, agencies placed 43,164 new orders under the GSA Multiple Award Schedule in FY2021 and 23,034 in FY2026. Obligations on Schedule orders over the same months went from $11.71 billion to $13.82 billion, in current dollars. In both years more than half of the new orders were GSA buying for itself; the rest of government shows nearly the same decline.
Intelligent Win · Market Intelligence — measured on intelligent.win’s contract corpus.
Agencies placed 23,034 new orders under the GSA Multiple Award Schedule from October 2025 through June 2026. In the same nine months of FY2021 they placed 43,164. That is 46.6% fewer.
The money moved the other way. Obligations on Schedule orders in those nine months rose from $11.71 billion in FY2021 to $13.82 billion in FY2026, up 18.0%, in current dollars, not adjusted for inflation.
The two lines are measured differently on purpose. The order count is new orders: each order counted once, in the month it was signed. The dollar line is every obligation on Schedule orders in the window, including money added to orders signed in earlier years, net of de-obligations.
GSA itself is more than half the count. In both years more than half of new Schedule orders were placed and paid for by GSA’s own supply operation: 23,365 in FY2021 and 12,322 in FY2026, most of them under $10,000. Leaving those out, new orders from the rest of government fell from 19,799 to 10,712, down 45.9%, and their obligations rose from $11.43 billion to $13.36 billion, up 16.9%.
Why October through June. Defense contract records reach the public file about 90 days after signing. In the October 6, 2026 release, defense Schedule orders run 787 new orders in June 2026, 115 in July, and none in August or September, so June is the last month complete for every agency. Every year here uses the same nine months.
Civilian agencies have a complete FY2026. For the full year, civilian new Schedule orders went from 50,854 in FY2021 to 28,787 in FY2026, down 43.4%. Without GSA’s own supply orders, civilian new orders went from 17,769 to 10,391, down 41.5%, and their obligations from $13.56 billion to $17.42 billion, up 28.5%. Defense FY2026 is not complete in this release, so it is not added in.
Where the orders went. Orders whose first action was under $10,000 fell from 30,210 to 13,499 over the October through June window. GSA’s own supply orders account for 77% of that small-order decline. Across the rest of government, small orders are 42% of that group’s drop, so most of the rest of government’s decline is in larger orders.
The first thing we did was try to break it.
- October and November 2025 coincide with the 43-day lapse in appropriations, and new orders in those two months were about half the prior year’s. Leaving both months out of every year, December through June still falls 43.1% from FY2021 to FY2026.
- Blanket purchase agreements set up under Schedule contracts did not absorb the decline. New calls under them fell 13.0% over the same window, from 456,065 to 396,618.
- Today’s holder list would understate the change. Counting only contracts on GSA’s current roster shows a 13.6% decline, because contracts that have since expired or been replaced under new numbers drop out of the early years. Every figure here uses the government’s own record of which orders were placed under the Schedule.
This note describes what the federal record shows. It does not say why ordering changed, or what the next year will look like.
These numbers came out of the platform, not a spreadsheet.
The same contract corpus behind this note — 2.6 million contracts, reconciled against the government’s own published totals before anything publishes — is what the product runs on. If you want to see how it’s assembled and checked, that’s written up in full.