Ecosystem Report · October 2026
FY2026 Closes: Civilian Contract Obligations Up 23%, Defense Up 18% Through June, With Defense's Final Quarter Still to Land
The monthly read of the federal contract record, as of the October 6, 2026 USASpending release. Contracts awarded by civilian agencies reached $370.57 billion in fiscal 2026, up 22.9%. Defense contract obligations rose 18.4% from October through June, the months its record is complete; its July to September records arrive over the next three releases, and we show a labelled estimate of where they may land. On the civilian side, September carried its smallest share of the civilian services year in seven years of record.
Intelligent Win · Market Intelligence — measured on intelligent.win’s contract corpus.
This is the monthly read of the federal prime contract record, as of the October 6, 2026 USASpending release. For civilian agencies, it is the first file that holds a complete fiscal 2026.
Bottom line
- Contracts awarded by civilian agencies reached $370.57 billion in fiscal 2026, up 22.9% from $301.47 billion in fiscal 2025.
- Homeland Security is 65.1% of that increase, more than half of it border construction at Customs and Border Protection. The rest of the civilian government rose 8.8%.
- September did not grow with the year. Civilian services obligations in September were $47.51 billion, 1.5% below last September, while the full civilian services year rose 20.3%. On this first read, September carried 15.85% of the civilian services year, the smallest share in any year back to FY2020.
- Defense contract obligations rose 18.4% from October through June, to $370.96 billion, the months its record is complete. July to September so far reads $3.60 billion, a small fraction of what is still to be reported. Applying defense’s own FY2022 to FY2025 pattern gives an estimate of $151 billion to $211 billion for those three months; defense reports about 90 days behind, so the January release is when fiscal 2026 defense becomes known.
Federal prime contract record, October 6, 2026 USASpending release.
Read this first: two windows, and a sliver
The Department of Defense publishes its contract records about 90 days after the fact. In this release, defense transactions fall from 336,714 in June to 41,544 in July. That is the delay, not a drop in spending. Every defense figure here stops at June 30, in both years. Civilian agencies show no such gap, so civilian figures run the full fiscal year.
Fiscal 2026 is therefore complete for civilian agencies and not yet complete for defense. An all-agency fiscal 2026 total printed today would be missing July through September, the three months that held 36.3% of defense contract obligations in fiscal 2025. We do not print one; the Defense section below shows what is reported and a labelled estimate for the rest.
Fiscal 2027 is in the file, but only October 1 through 4: 17,618 civilian transactions worth $2.20 billion, including 11,197 new civilian awards, and a single defense transaction. Four days describe nothing about a year.
Fiscal 2026, civilian, by the numbers
| Department | FY2025 | FY2026 |
|---|---|---|
| Veterans Affairs | $78.33B | $80.47B |
| Homeland Security | $28.44B | $73.46B |
| Energy | $50.26B | $57.09B |
| Health and Human Services | $26.77B | $30.00B |
| General Services Administration | $24.31B | $29.07B |
| NASA | $21.34B | $21.52B |
| Transportation | $9.89B | $14.85B |
| Agriculture | $9.64B | $10.72B |
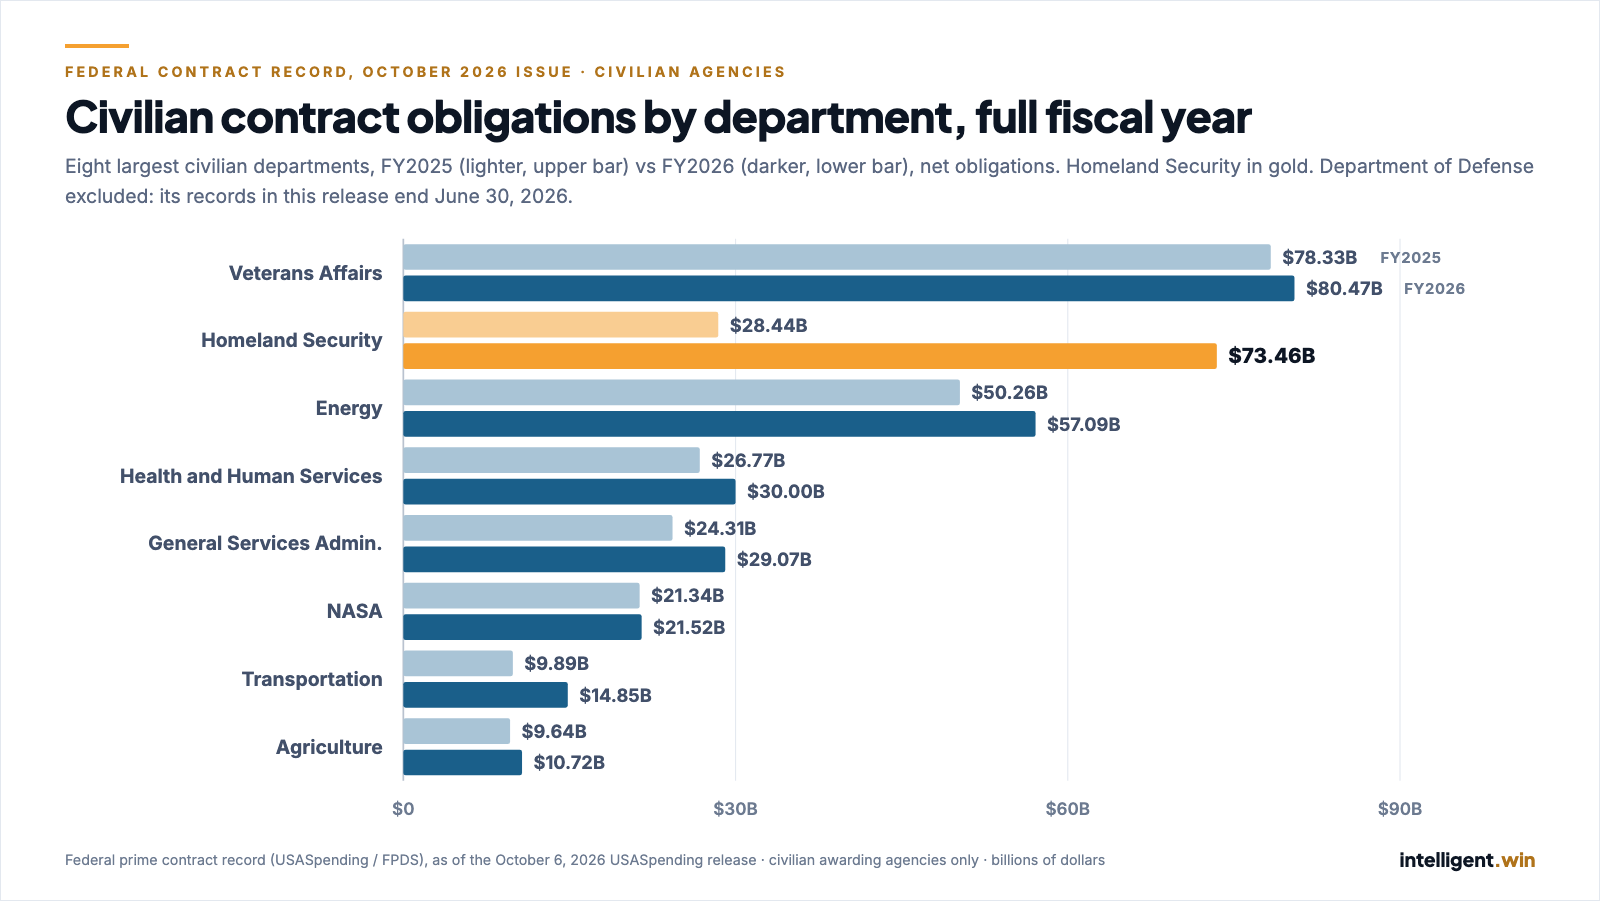
Homeland Security went from 9.4% of civilian contract obligations to 19.8%. The government’s own records show where. Customs and Border Protection construction obligations went from $5.24 billion across 110 awards in fiscal 2025 to $29.46 billion across 181 awards in fiscal 2026; $25.36 billion of that sits on awards whose descriptions mention a barrier or a wall. The Coast Guard added $6.77 billion on awards described as Arctic Security Cutters. Take Homeland Security out entirely, and civilian obligations rose from $273.02 billion to $297.12 billion, up 8.8%.
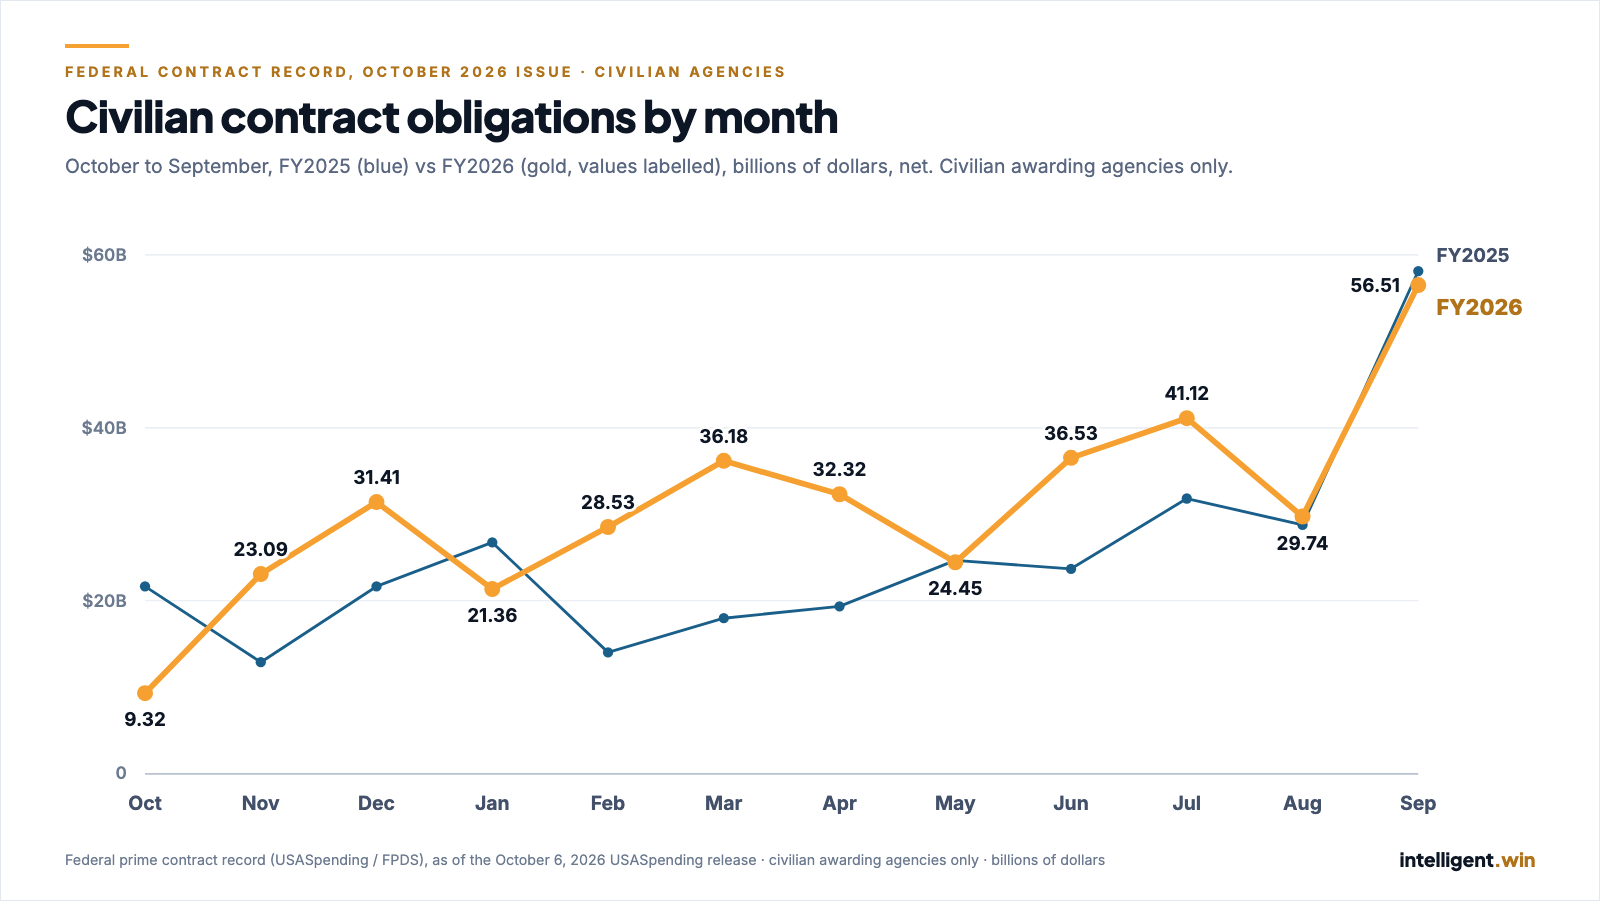
The monthly path shows the year was built outside September. Civilian obligations ran ahead of fiscal 2025 in most months from November on; the largest month before September was July, at $41.12 billion. September 2026 came in at $56.51 billion, against $58.13 billion a year earlier.
September, civilian, first read
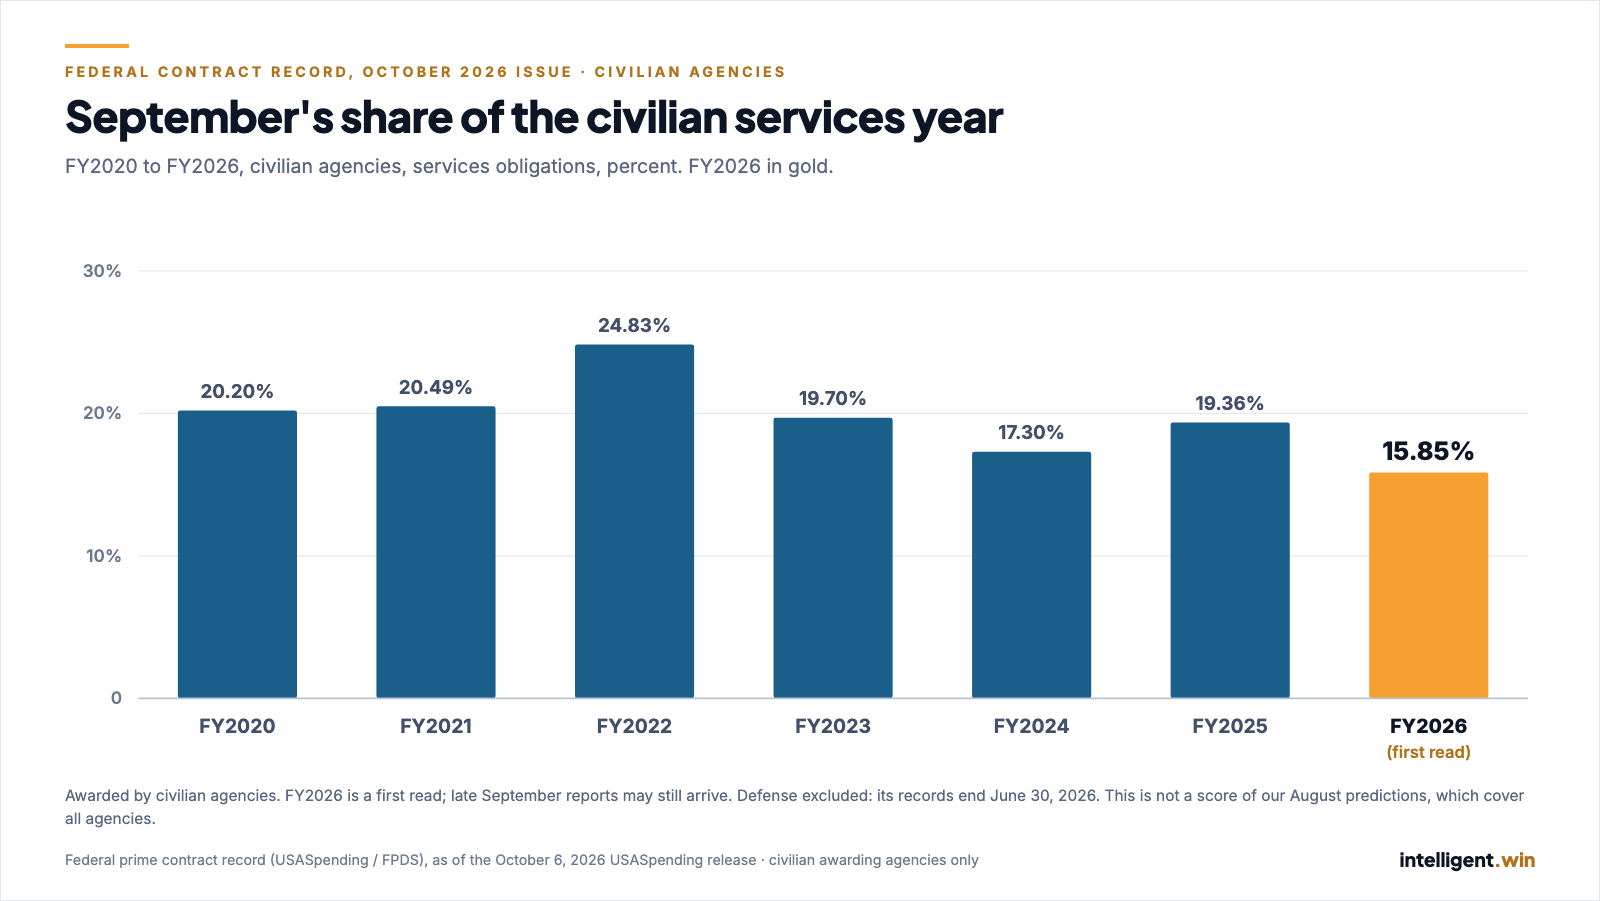
In August we published four predictions about September in Nine Percent of the Federal Services Year Happens in Seven Days. They were made on all agencies, and defense September arrives with the January release, so they get scored then. Measured on civilian agencies alone, against civilian agencies’ own history, September came in below every prior year on the share of the year and on the share of its final week.
| Civilian services | FY2020 | FY2021 | FY2022 | FY2023 | FY2024 | FY2025 | FY2026 |
|---|---|---|---|---|---|---|---|
| September share of the year | 20.20% | 20.49% | 24.83% | 19.70% | 17.30% | 19.36% | 15.85% |
| Final 7 days’ share of September | 57.19% | 51.44% | 60.00% | 46.76% | 48.10% | 49.06% | 44.54% |
September 30 was the fifth-largest civilian services day of the year, at $5.42 billion; the two largest fell on July 31 and March 5. September’s dollars held roughly flat while the rest of the year grew by a fifth, so its share fell. The record shows that; it does not show why.
We tried to break the low share two ways. Without Homeland Security, September was 15.79% of the civilian services year, against 17.10% in fiscal 2025. Late reports: the newest month always grows in the next release. Civilian August read $28.76 billion in the September 6 release and $29.74 billion in this one, up 3.4%. A September revision at that rate lifts its share only to about 16.30%. Getting back to the fiscal 2024 low of 17.30% would take about $5.27 billion more, an 11% revision. We will re-check in November.
New civilian awards in September
Civilian agencies signed 184,811 new contracts and orders in September worth $26.89 billion at signing. 153,504 of them, 83%, were General Services Administration orders, which last September averaged about $9,000 each. Every other civilian agency together signed 31,307, against 38,508 a year earlier, down 18.7%.
On dollars, recurring Veterans Affairs payment orders, whose descriptions begin “Express Report,” explain more than all of the year-over-year difference: $1.37 billion this September against $4.17 billion last. Set them aside in both years and new civilian money was up 1.5%. Awards of $1 million or more rose from 3,179 to 3,685.
Seven of the ten largest new civilian awards were construction: an embassy design-build for State, border facility design-builds for Customs and Border Protection, Coast Guard pier and homeport projects, and a research building addition at the National Institutes of Health.
Defense: reported through June, estimated for the rest
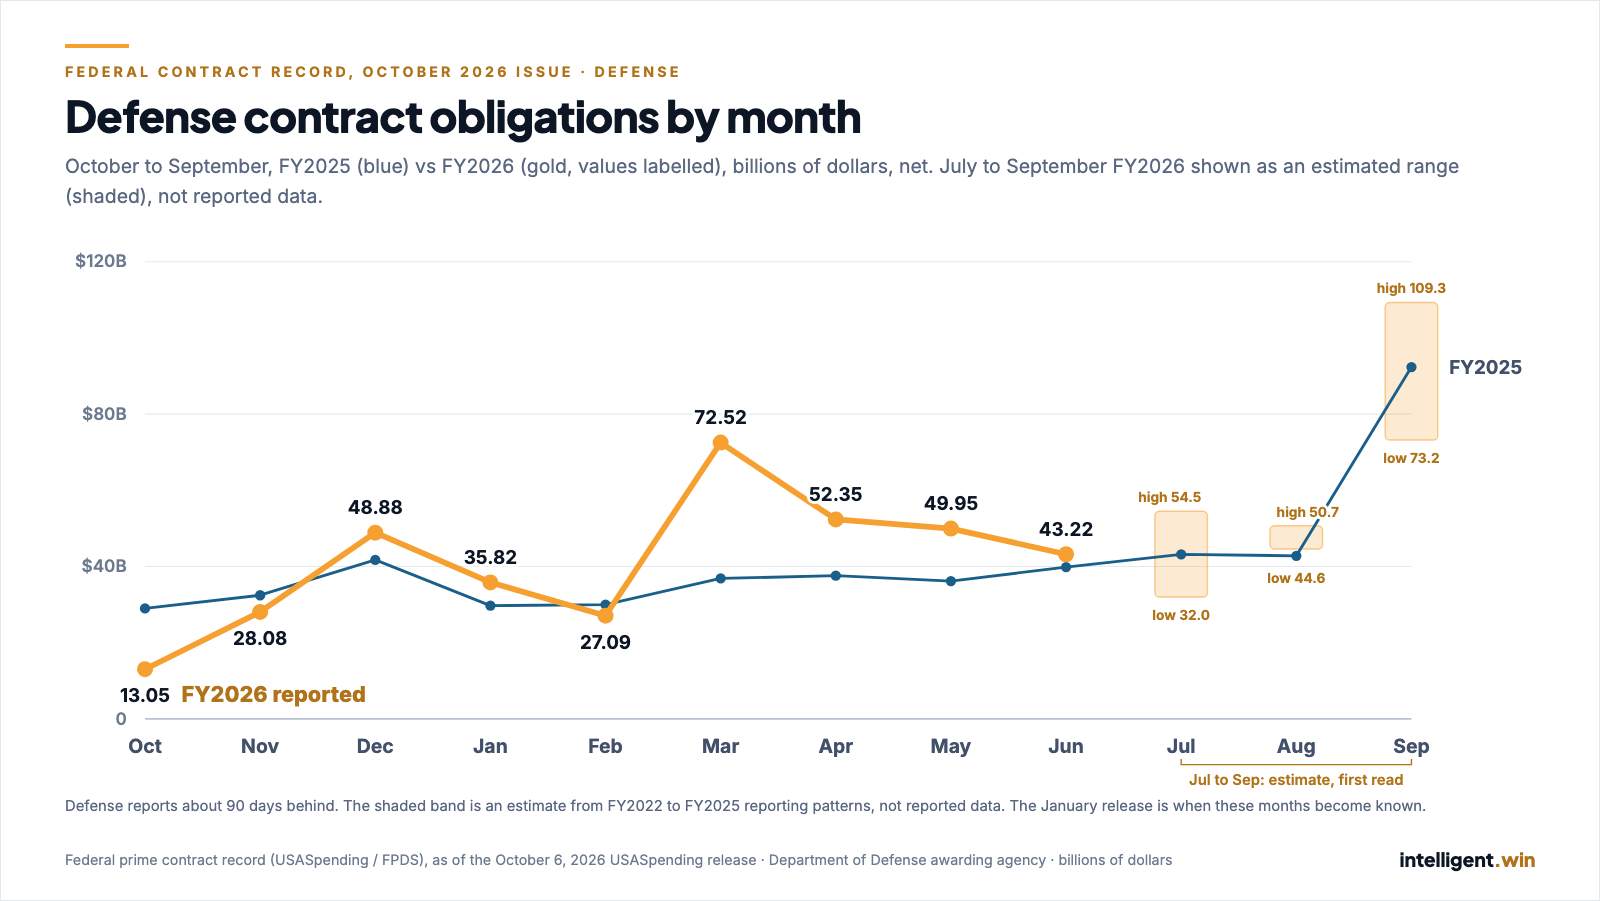
October through June, complete. Department of Defense contract obligations reached $370.96 billion, against $313.42 billion over the same nine months of fiscal 2025, up 18.4%. March alone was $72.52 billion, against $36.88 billion a year earlier.
July through September, as reported so far. This file holds $3.42 billion for July (41,544 transactions), $0.02 billion for August and $0.16 billion for September: $3.60 billion in all. Last year the same three months finished at $178.36 billion. What is in the file now is a small fraction of what is still to be reported.
Glide path (estimate, first read). In each of the four most recent completed years, FY2022 through FY2025 (the two earlier years in our record ran lower, 0.33 and 0.41, and would widen the floor), defense obligations from July through September ran at a fraction of the October to June total: 0.44 in FY2022, 0.41 in FY2023, 0.54 in FY2024 and 0.57 in FY2025. Applied to this year’s $370.96 billion, that pattern gives an estimate of $151 billion to $211 billion for July to September, and $522 billion to $583 billion for the fiscal year, against $491.78 billion in fiscal 2025. This is an estimate built from the government’s own prior-year pattern, not a reported figure, and defense reports about 90 days behind, so the January release is when fiscal 2026 defense becomes known. The two most recent years sit at the top of the range ($202 billion and $211 billion); this year’s unusually large March also lifts every end of it.
Measured on this year’s own filings. Between the September and October releases, defense obligations for April through June grew by 32.0% (from $110.24 billion to $145.52 billion), the first month of the 90-day catch-up measured on this year’s own filings. Nearly all of it was June: $8.73 billion in the September file, $43.22 billion in the October file, about five times the first read, while April and May moved by about 1%. July moved from $0.05 billion to $3.42 billion in the same step. That is the pattern the current $3.60 billion sits inside: each release has filled in about one more month, and a month’s first read has been a small fraction of where it settled, in the one step we can measure. On that observation, today’s July to September figure says little about the level, and nothing in it contradicts the estimated range above.
What is open now
Among services solicitations open on SAM.gov on October 19, 897 have responses due by December 31. 290 are total small business set-asides and 93 are service-disabled veteran-owned small business set-asides. Another 427 services sources sought notices were posted between October 1 and 18.
These are snapshots of what is open today. SAM.gov drops notices once they archive, so a comparison with last October is not possible from this source, and we do not offer one.
A note on our leaderboards
With the new fiscal year, our public NAICS leaderboards now rank on a rolling 60-month window that ends 90 days behind the latest release, currently July 2021 through June 2026.
What we will check in November
- Whether late reports lift civilian September back toward its historical range.
- Defense July, which the next release should complete, against the July estimate of $32.0 billion to $54.5 billion.
- An other-transactions read: the public OT record available to us was last refreshed in August, so this issue does not carry one.
These numbers came out of the platform, not a spreadsheet.
The same contract corpus behind this note — 2.6 million contracts, reconciled against the government’s own published totals before anything publishes — is what the product runs on. If you want to see how it’s assembled and checked, that’s written up in full.