Market Note · 27 September 2026
3 in 10 Stand-Alone Federal Services Awards Drew One Offer
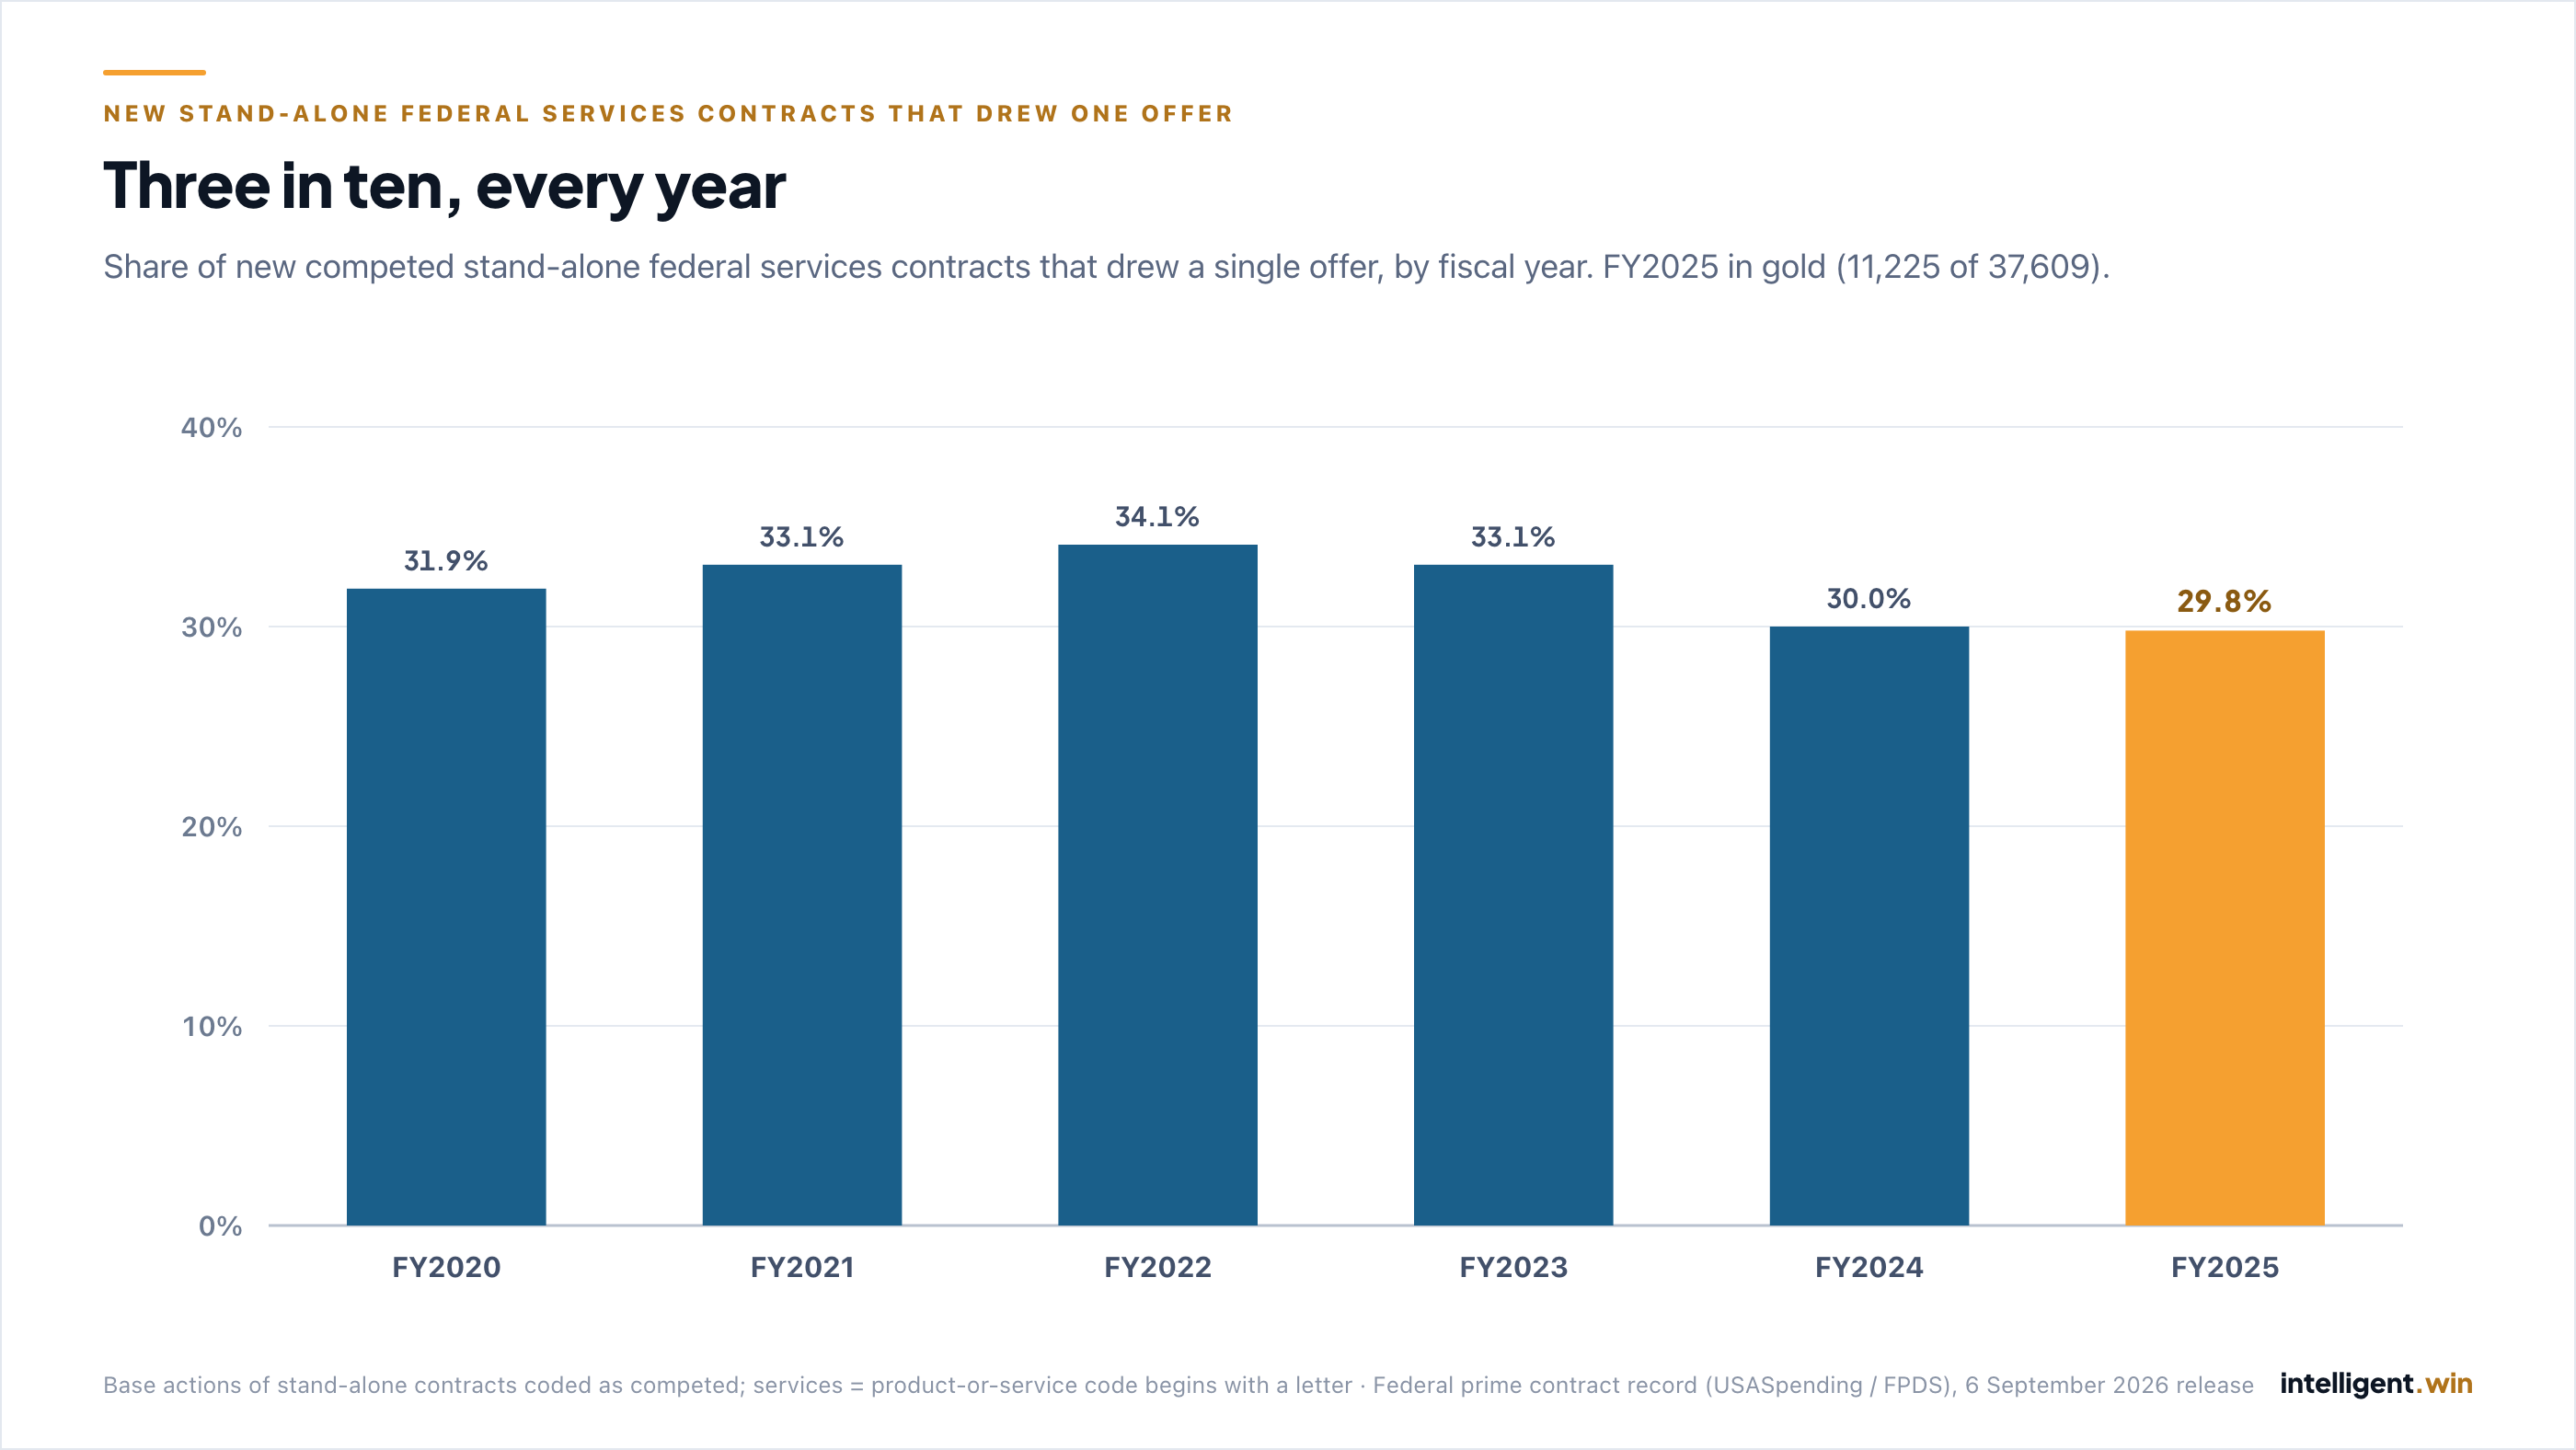
When a federal agency competed a new stand-alone services contract in FY2025, only one company bid 29.8% of the time. The share has barely moved in six years. It is highest in IT and R&D, lowest in construction and transportation, and it does not fall away on big contracts.
Intelligent Win · Market Intelligence — measured on intelligent.win’s contract corpus.
In FY2025, federal agencies signed 37,609 new stand-alone services contracts that the government’s own record codes as competed. 11,225 of them drew exactly one offer.
That is 29.8%. Roughly three competitions in ten had one bidder.
It is not a bad year. Over the six completed fiscal years we can measure, the share has never been lower than 29.8% or higher than 34.1%.
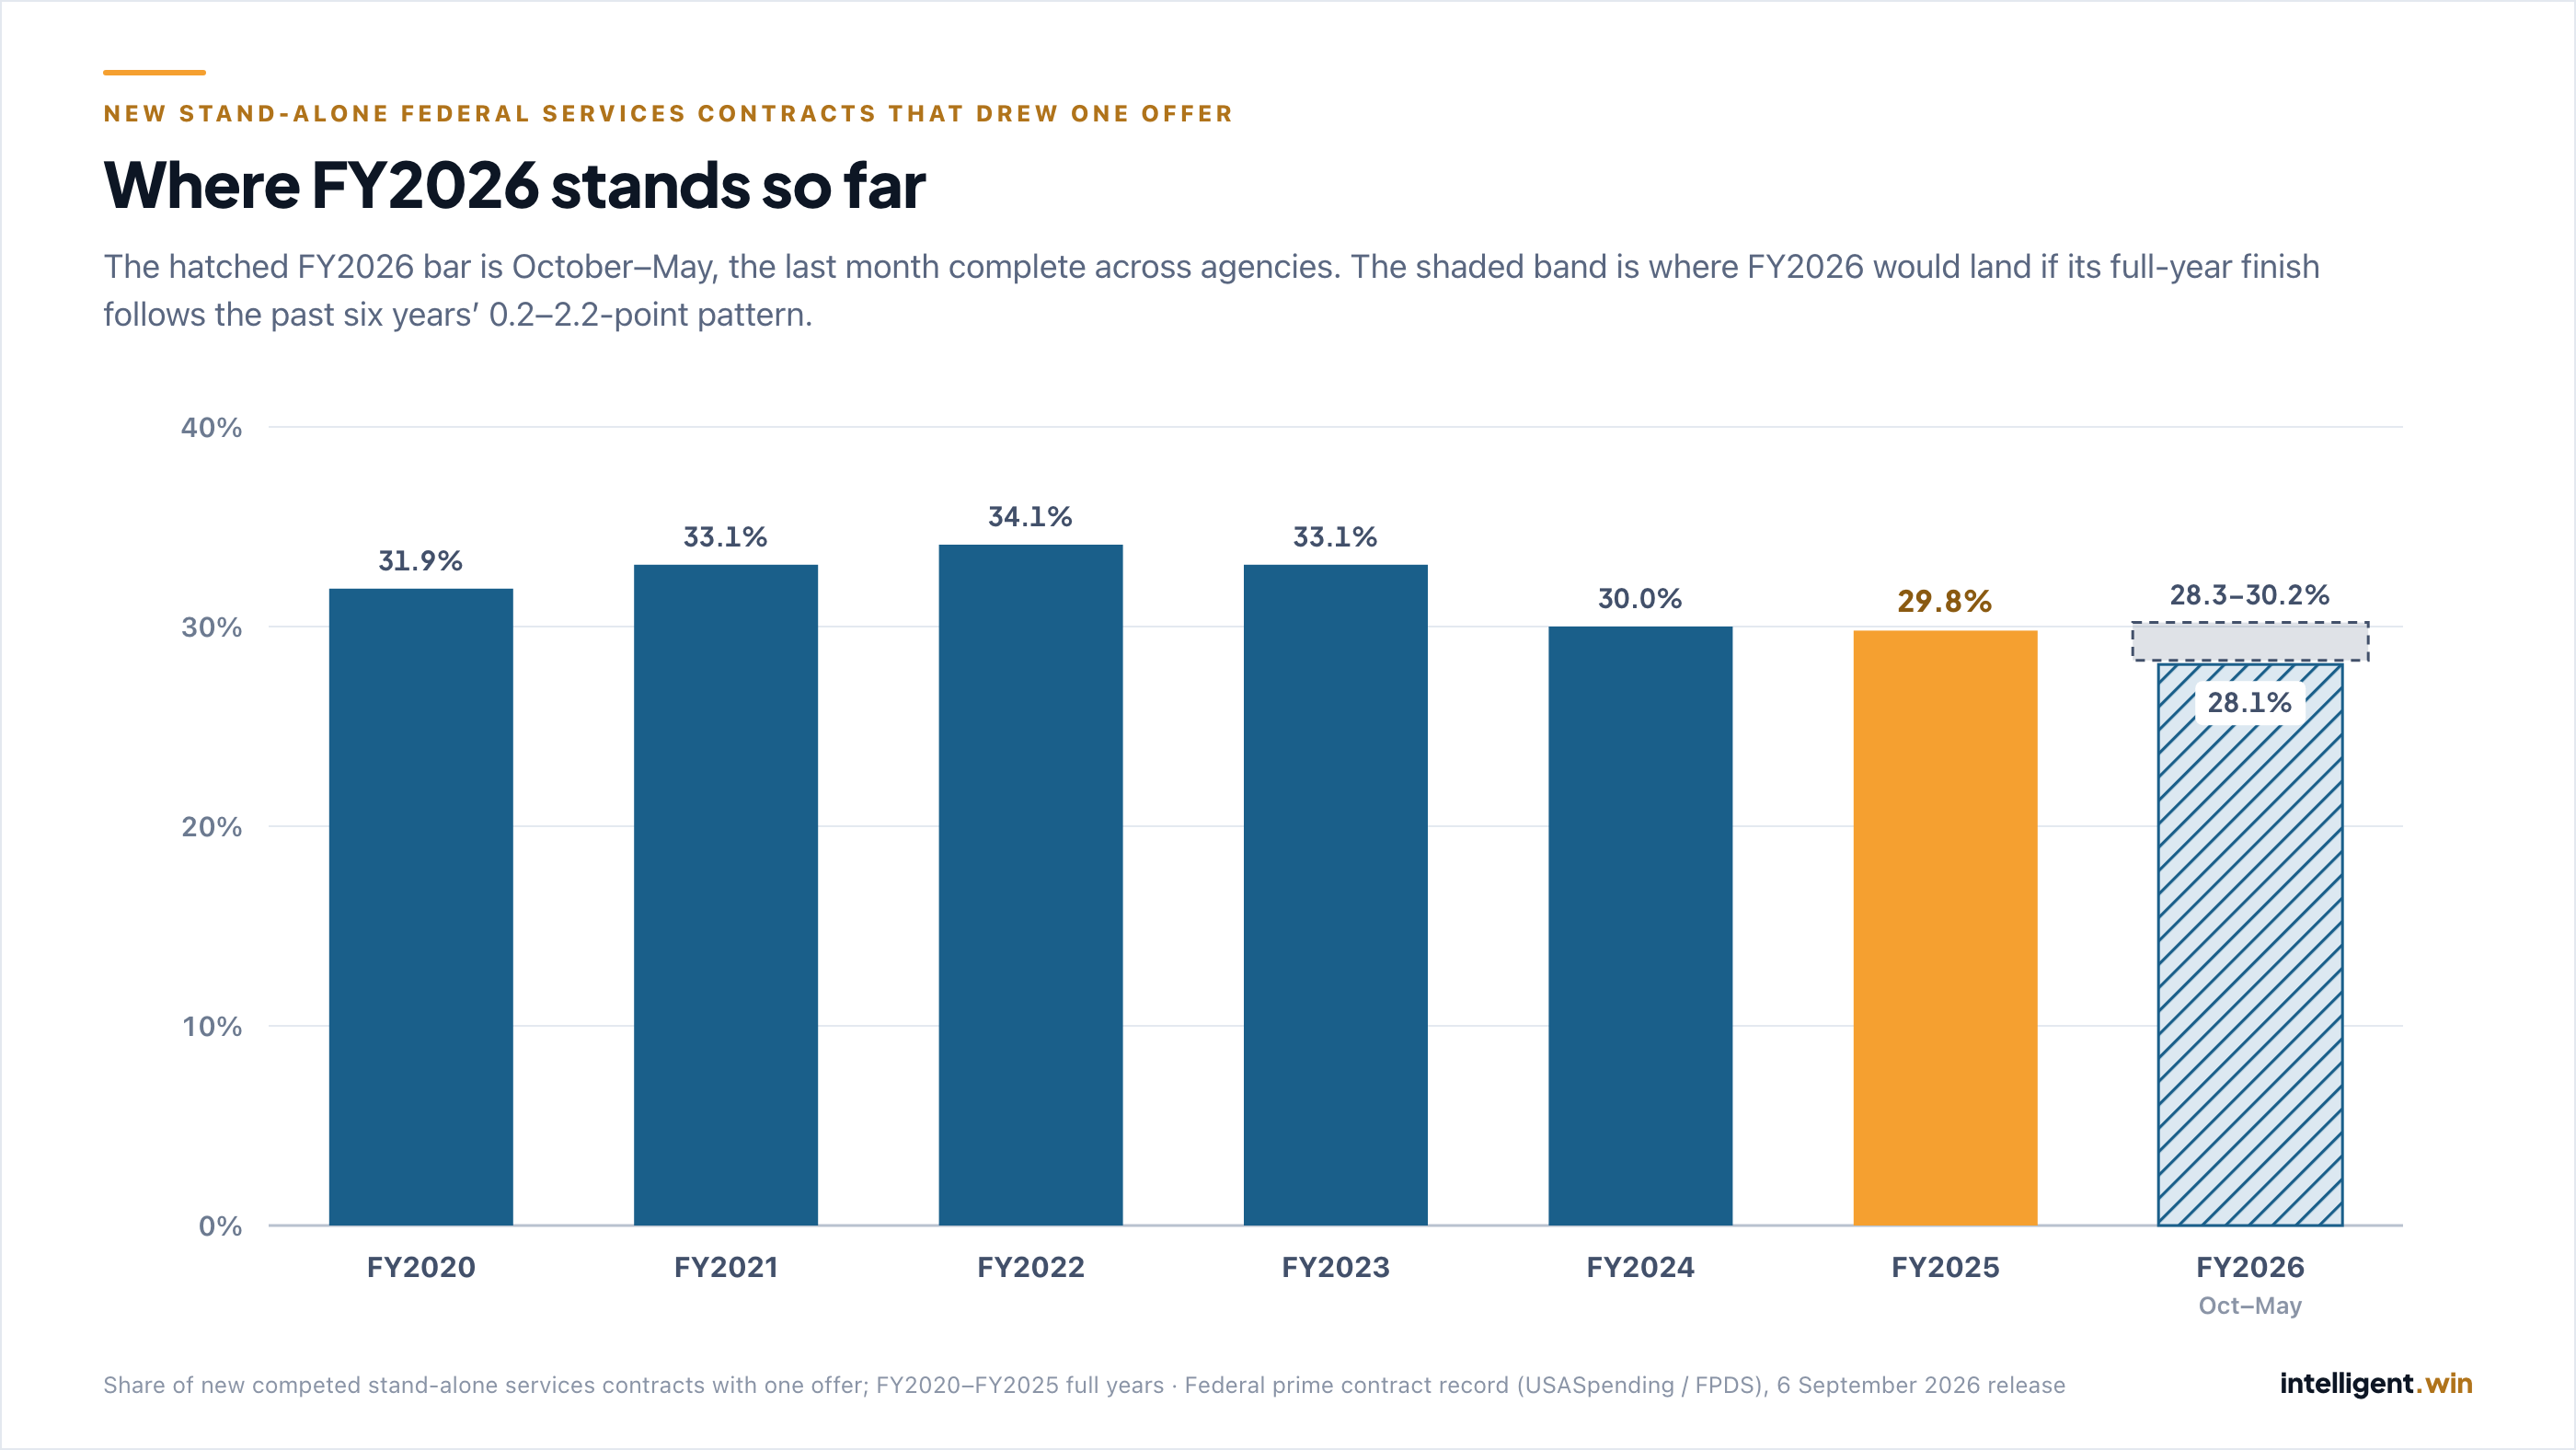
FY2026 so far looks the same. From October through May, 3,937 of 14,027 competed stand-alone services contracts drew one offer: 28.1%, against 29.3% for the same eight months of FY2025. FY2026 runs through May: the 6 September 2026 federal data release carries defense awards only through early June, so May is the last month complete across every agency. We compare it with October–May of FY2025, not the whole year, because the first eight months of a year run slightly lower than the full year.
| October–May | New competed stand-alone services contracts | Drew one offer | Share |
|---|---|---|---|
| FY2025 | 17,689 | 5,185 | 29.3% |
| FY2026 | 14,027 | 3,937 | 28.1% |
In each of the past six years the full-year share finished 0.2 to 2.2 points above the October-to-May share; if FY2026 follows that pattern it would end between about 28.3% and 30.2%.
New competed stand-alone federal services contracts, FY2025, by the number of offers recorded on the award.
Six years, nearly flat
| Fiscal year | New competed stand-alone services contracts | Drew one offer | Share |
|---|---|---|---|
| FY2020 | 53,651 | 17,136 | 31.9% |
| FY2021 | 49,800 | 16,461 | 33.1% |
| FY2022 | 47,544 | 16,226 | 34.1% |
| FY2023 | 45,010 | 14,888 | 33.1% |
| FY2024 | 43,637 | 13,089 | 30.0% |
| FY2025 | 37,609 | 11,225 | 29.8% |
Where one offer is most common
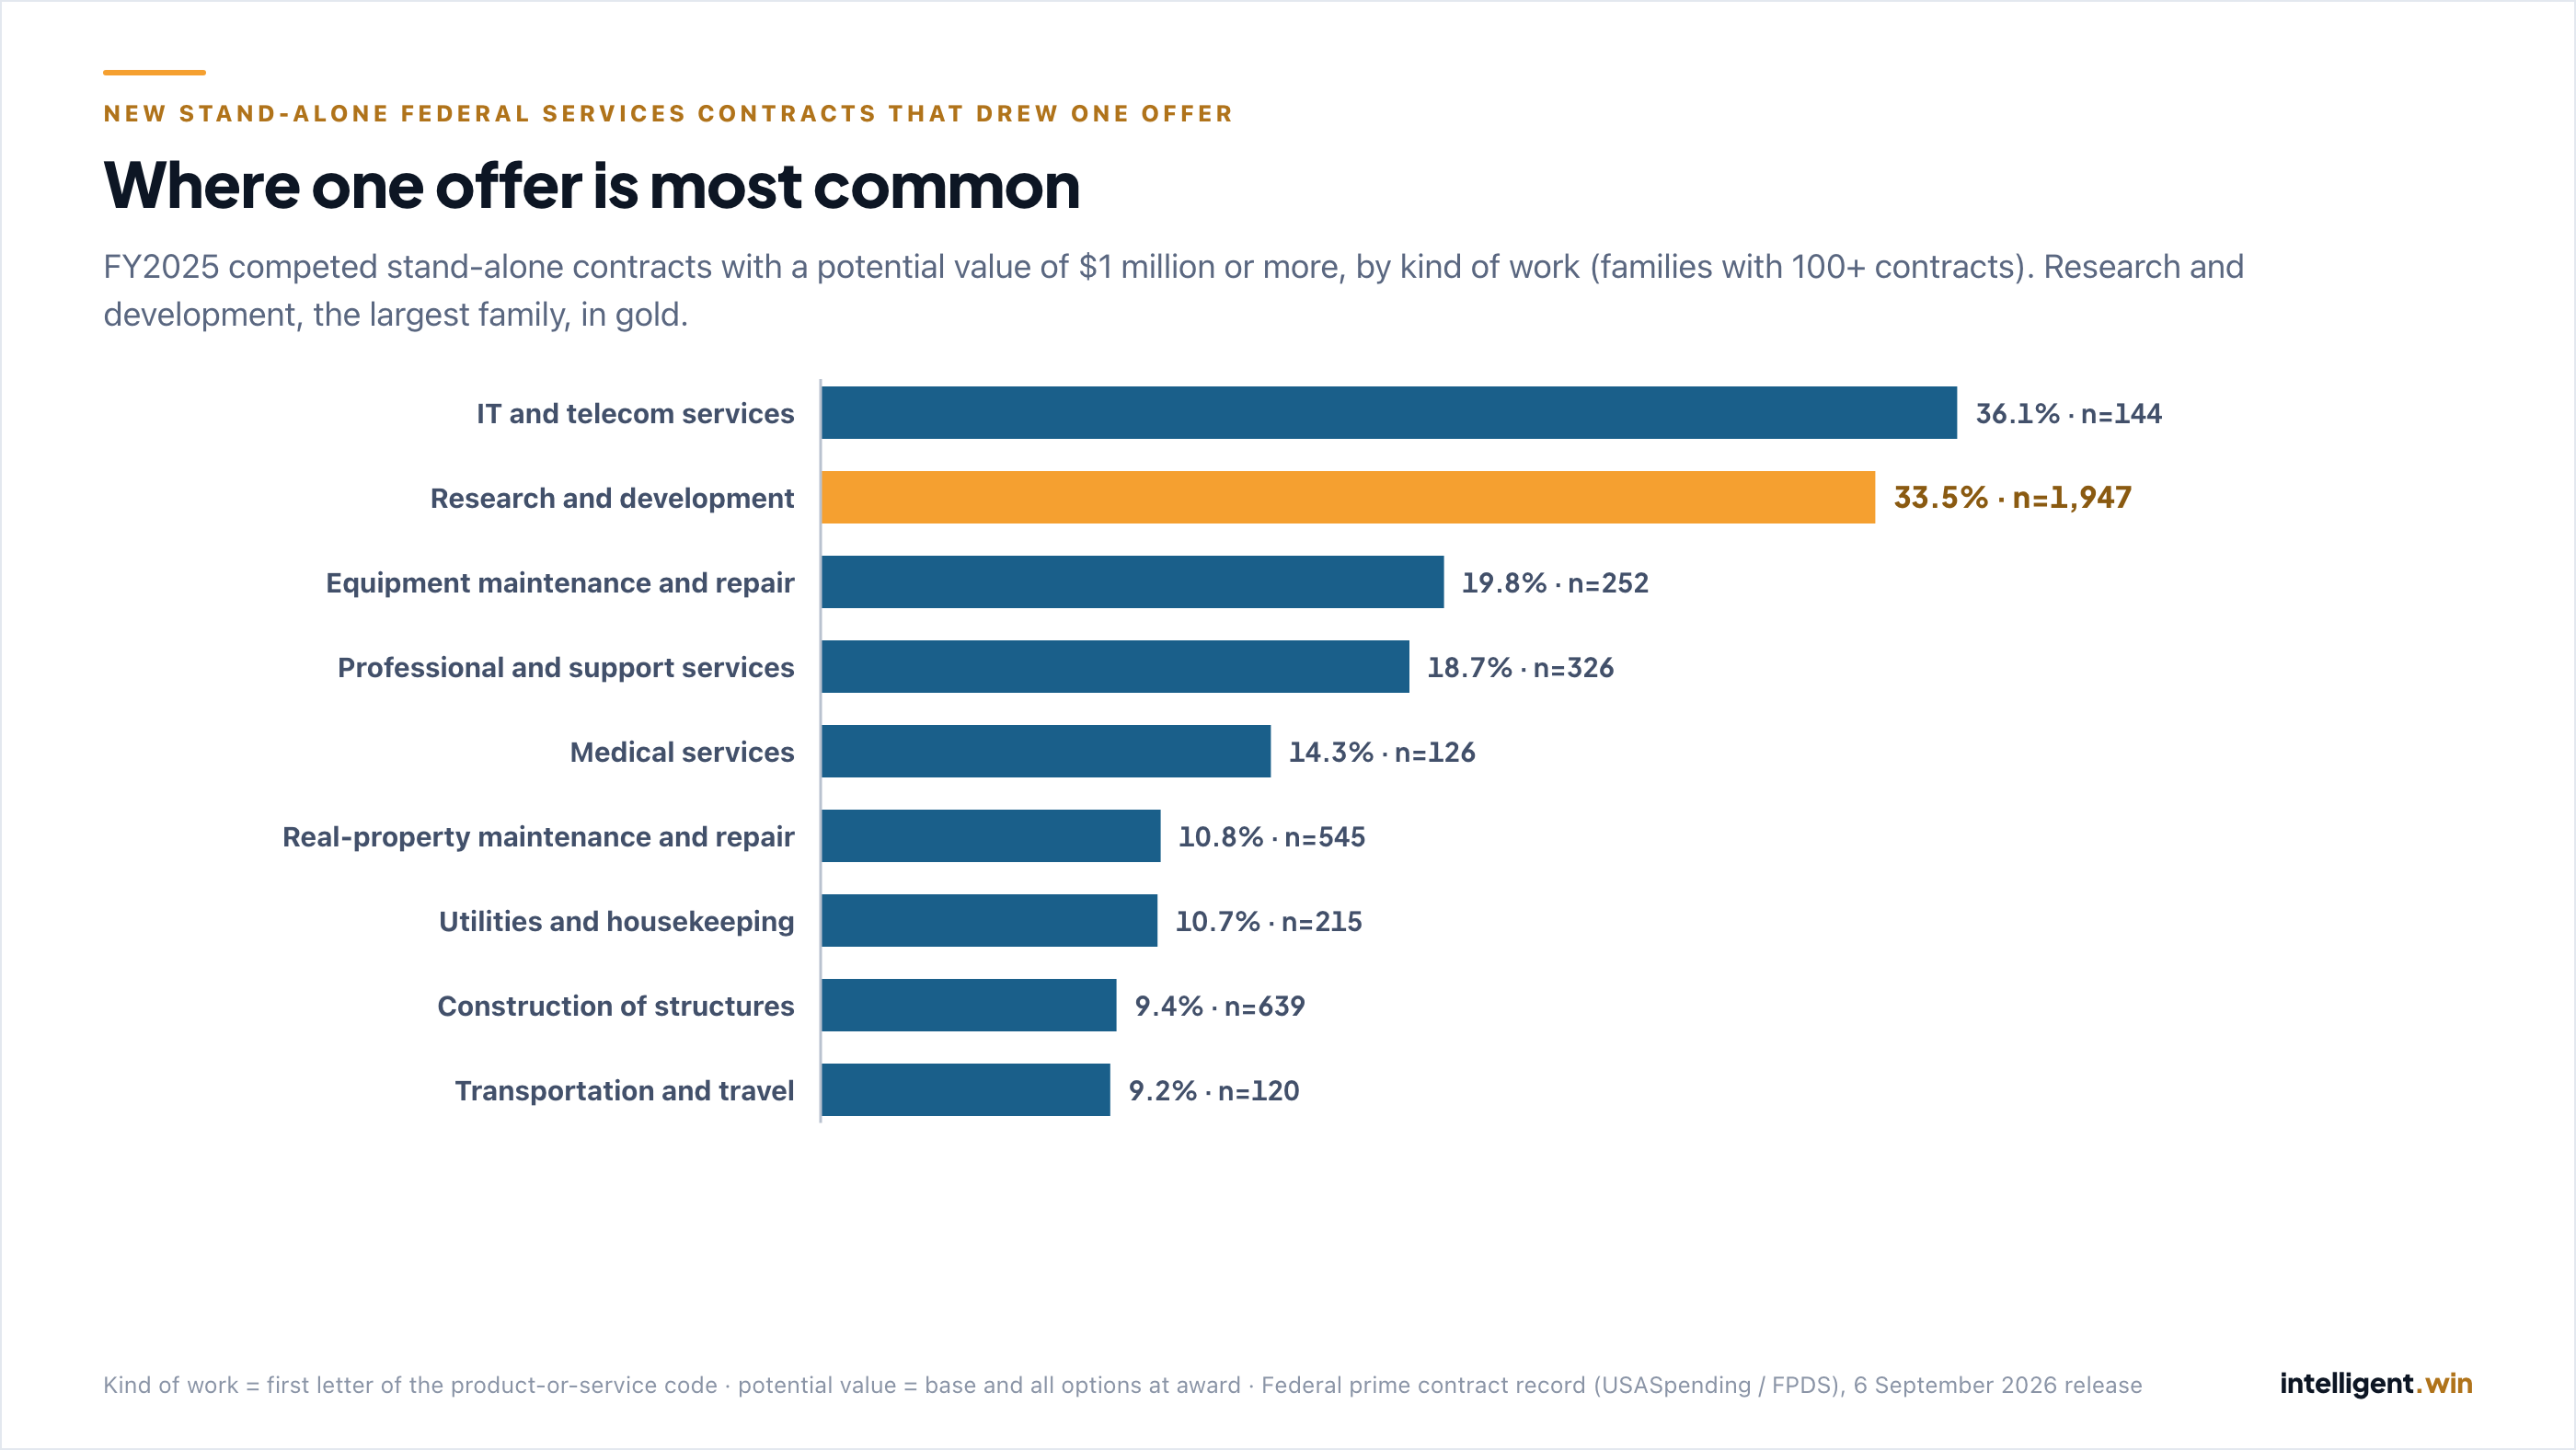
The kind of work matters more than anything else we tested. On contracts with a potential value of $1 million or more, FY2025:
| Kind of work | Contracts | Drew one offer | Share | FY2023–FY2025 pooled |
|---|---|---|---|---|
| IT and telecom services | 144 | 52 | 36.1% | 33.7% |
| Research and development | 1,947 | 652 | 33.5% | 32.1% |
| Equipment maintenance and repair | 252 | 50 | 19.8% | 20.6% |
| Professional and support services | 326 | 61 | 18.7% | 20.4% |
| Medical services | 126 | 18 | 14.3% | 18.6% |
| Real-property maintenance and repair | 545 | 59 | 10.8% | 12.0% |
| Utilities and housekeeping | 215 | 23 | 10.7% | 9.6% |
| Construction of structures | 639 | 60 | 9.4% | 10.4% |
| Transportation and travel | 120 | 11 | 9.2% | 11.2% |
Families with fewer than 100 contracts in FY2025 are left out of this table. The pooled three-year column is there to show the ordering is not a one-year accident.
The first thing we did was try to break it
- Construction. Construction and real-property maintenance draw more bidders (13.6% single-offer in FY2025) and sit inside the standard services cut. Take them out and the share goes up: 32.4% in FY2025, between 32.3% and 36.5% in every year since FY2020.
- Contract size. Most of the 37,609 are small. So we re-ran it by potential value at award, construction excluded. FY2025: under $250K 34.4%; $250K–$1M 21.2%; $1M–$10M 26.1%; $10M–$100M 31.3%; $100M and up 20.5% (16 of 78). Every band sits between 20% and 35%. On non-construction contracts worth $10M or more together, 29.5% (140 of 474). One offer is not a small-purchase quirk.
- Basic research. Some research awards come from broad announcements where each proposal is its own. Removing the awards the record codes as basic research leaves the FY2025 figure at 29.9%.
- Defense and civilian. On non-construction contracts worth $1M or more, FY2025: Department of Defense 30.4%, civilian agencies 15.9%. Part of that gap is the mix of work — defense buys far more research and development — but defense runs higher within the same kinds of work too (research and development: 34.2% vs 23.8%).
- Set-aside or not. Among the same defense contracts, full and open competitions drew one offer 38.6% of the time, competitions restricted to a class of firms (mostly small-business set-asides) 30.2%. Civilian: 18.1% and 13.4%. Restricting the field did not produce more single-bid competitions.
What this does and does not say
It says roughly three in ten competed stand-alone federal services contracts had one bidder, every year for six years and so far in FY2026, and that IT and research work carry the highest shares.
It does not say anything was wrong with any of these competitions. One offer can mean a narrow requirement, a short response window, an incumbent nobody chose to challenge, or a market with few qualified firms. The record tells us how many offers arrived, not why.
It does not cover task and delivery orders under existing contract vehicles. Those carry most federal services dollars, but the offer count is blank on 44.1% of new competed services orders in the record, so any single-offer rate for orders would describe the half that got filled in, not the market.
This piece stops at government-wide totals. Which offices see the most single-bid competitions, and who wins them, is where the platform picks up.
These numbers came out of the platform, not a spreadsheet.
The same contract corpus behind this note — 2.6 million contracts, reconciled against the government’s own published totals before anything publishes — is what the product runs on. If you want to see how it’s assembled and checked, that’s written up in full.