Market Note · 6 October 2026
53 Buying Offices Handle Half of Federal Services Dollars
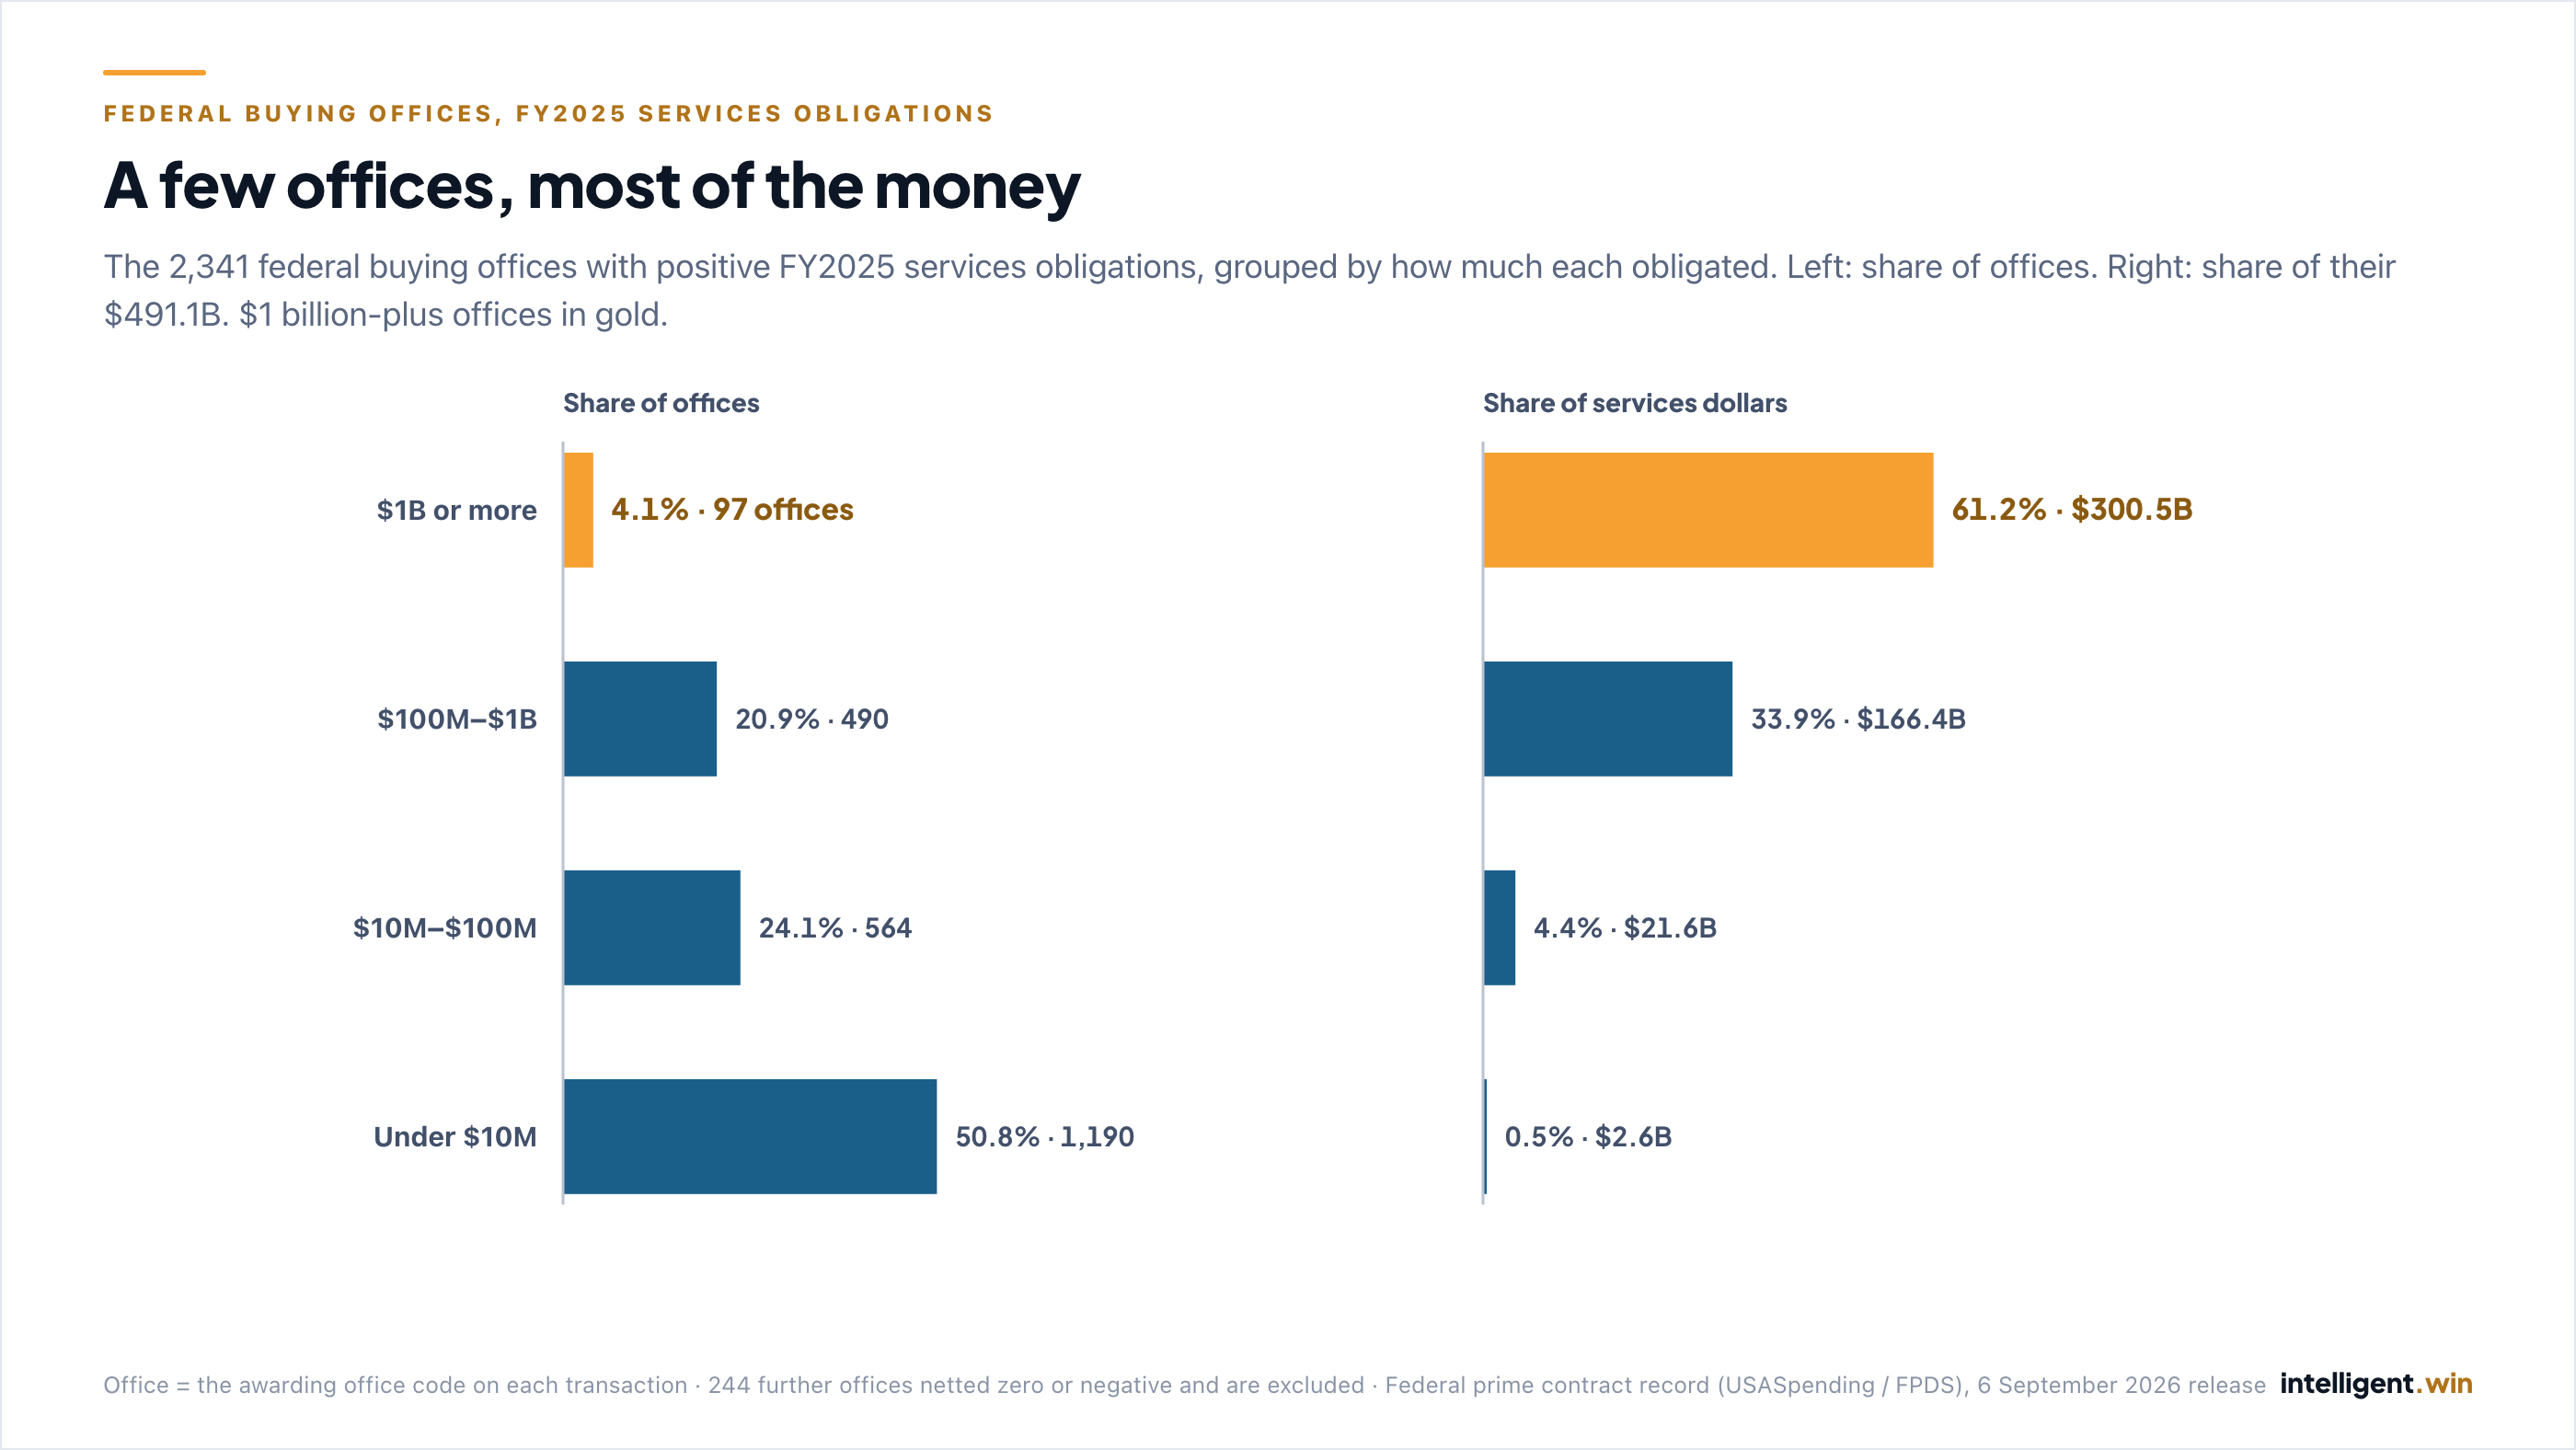
In FY2025, half of the $487.3 billion the federal government obligated for services went through 53 contracting offices, out of 2,341 that bought any. Thirteen offices handled half of all civilian services dollars. Here is the list, and how steady the pattern is.
Intelligent Win · Market Intelligence — measured on intelligent.win’s contract corpus.
Federal agencies obligated $487.3 billion for services in FY2025, through 2,341 contracting offices that recorded positive services obligations.
Half of that money went through 53 of them. The largest 10 alone handled a quarter.
On the civilian side the concentration is sharper: 13 offices handled half of the $249.3 billion civilian agencies obligated for services, out of 1,455. For the Department of Defense, it took 46 offices out of 886.
FY2025 net services obligations by awarding office.
The 13 civilian offices
| # | Office (as named in the federal record) | Department / component | FY2025 services obligations | Cumulative share of civilian |
|---|---|---|---|---|
| 1 | Strategic Acquisition Center Fredericksburg | Veterans Affairs | $34.15B | 13.7% |
| 2 | NNSA M&O Contracting | Energy | $23.66B | 23.2% |
| 3 | GSA FAS AAS FEDSIM | General Services Administration | $9.28B | 26.9% |
| 4 | Strategic Acquisition Center Frederick | Veterans Affairs | $8.56B | 30.4% |
| 5 | Office of Acquisition and Grants Management | HHS — Centers for Medicare & Medicaid Services | $7.79B | 33.5% |
| 6 | Acquisitions — AQM Momentum | State | $7.44B | 36.5% |
| 7 | Technology Acquisition Center NJ | Veterans Affairs | $6.77B | 39.2% |
| 8 | Administration Facilities Training Contracting Division | DHS — Customs and Border Protection | $5.89B | 41.5% |
| 9 | SC Oak Ridge Office | Energy | $5.50B | 43.7% |
| 10 | NASA Johnson Space Center | NASA | $4.65B | 45.6% |
| 11 | SC Chicago Service Center | Energy | $4.52B | 47.4% |
| 12 | NASA Marshall Space Flight Center | NASA | $3.69B | 48.9% |
| 13 | NASA Goddard Space Flight Center | NASA | $3.02B | 50.1% |
The largest defense office, the Defense Health Agency, obligated $14.20B. The ten largest defense offices together handled 21.7% of defense services dollars.
Steady for five years, tighter in the sixth
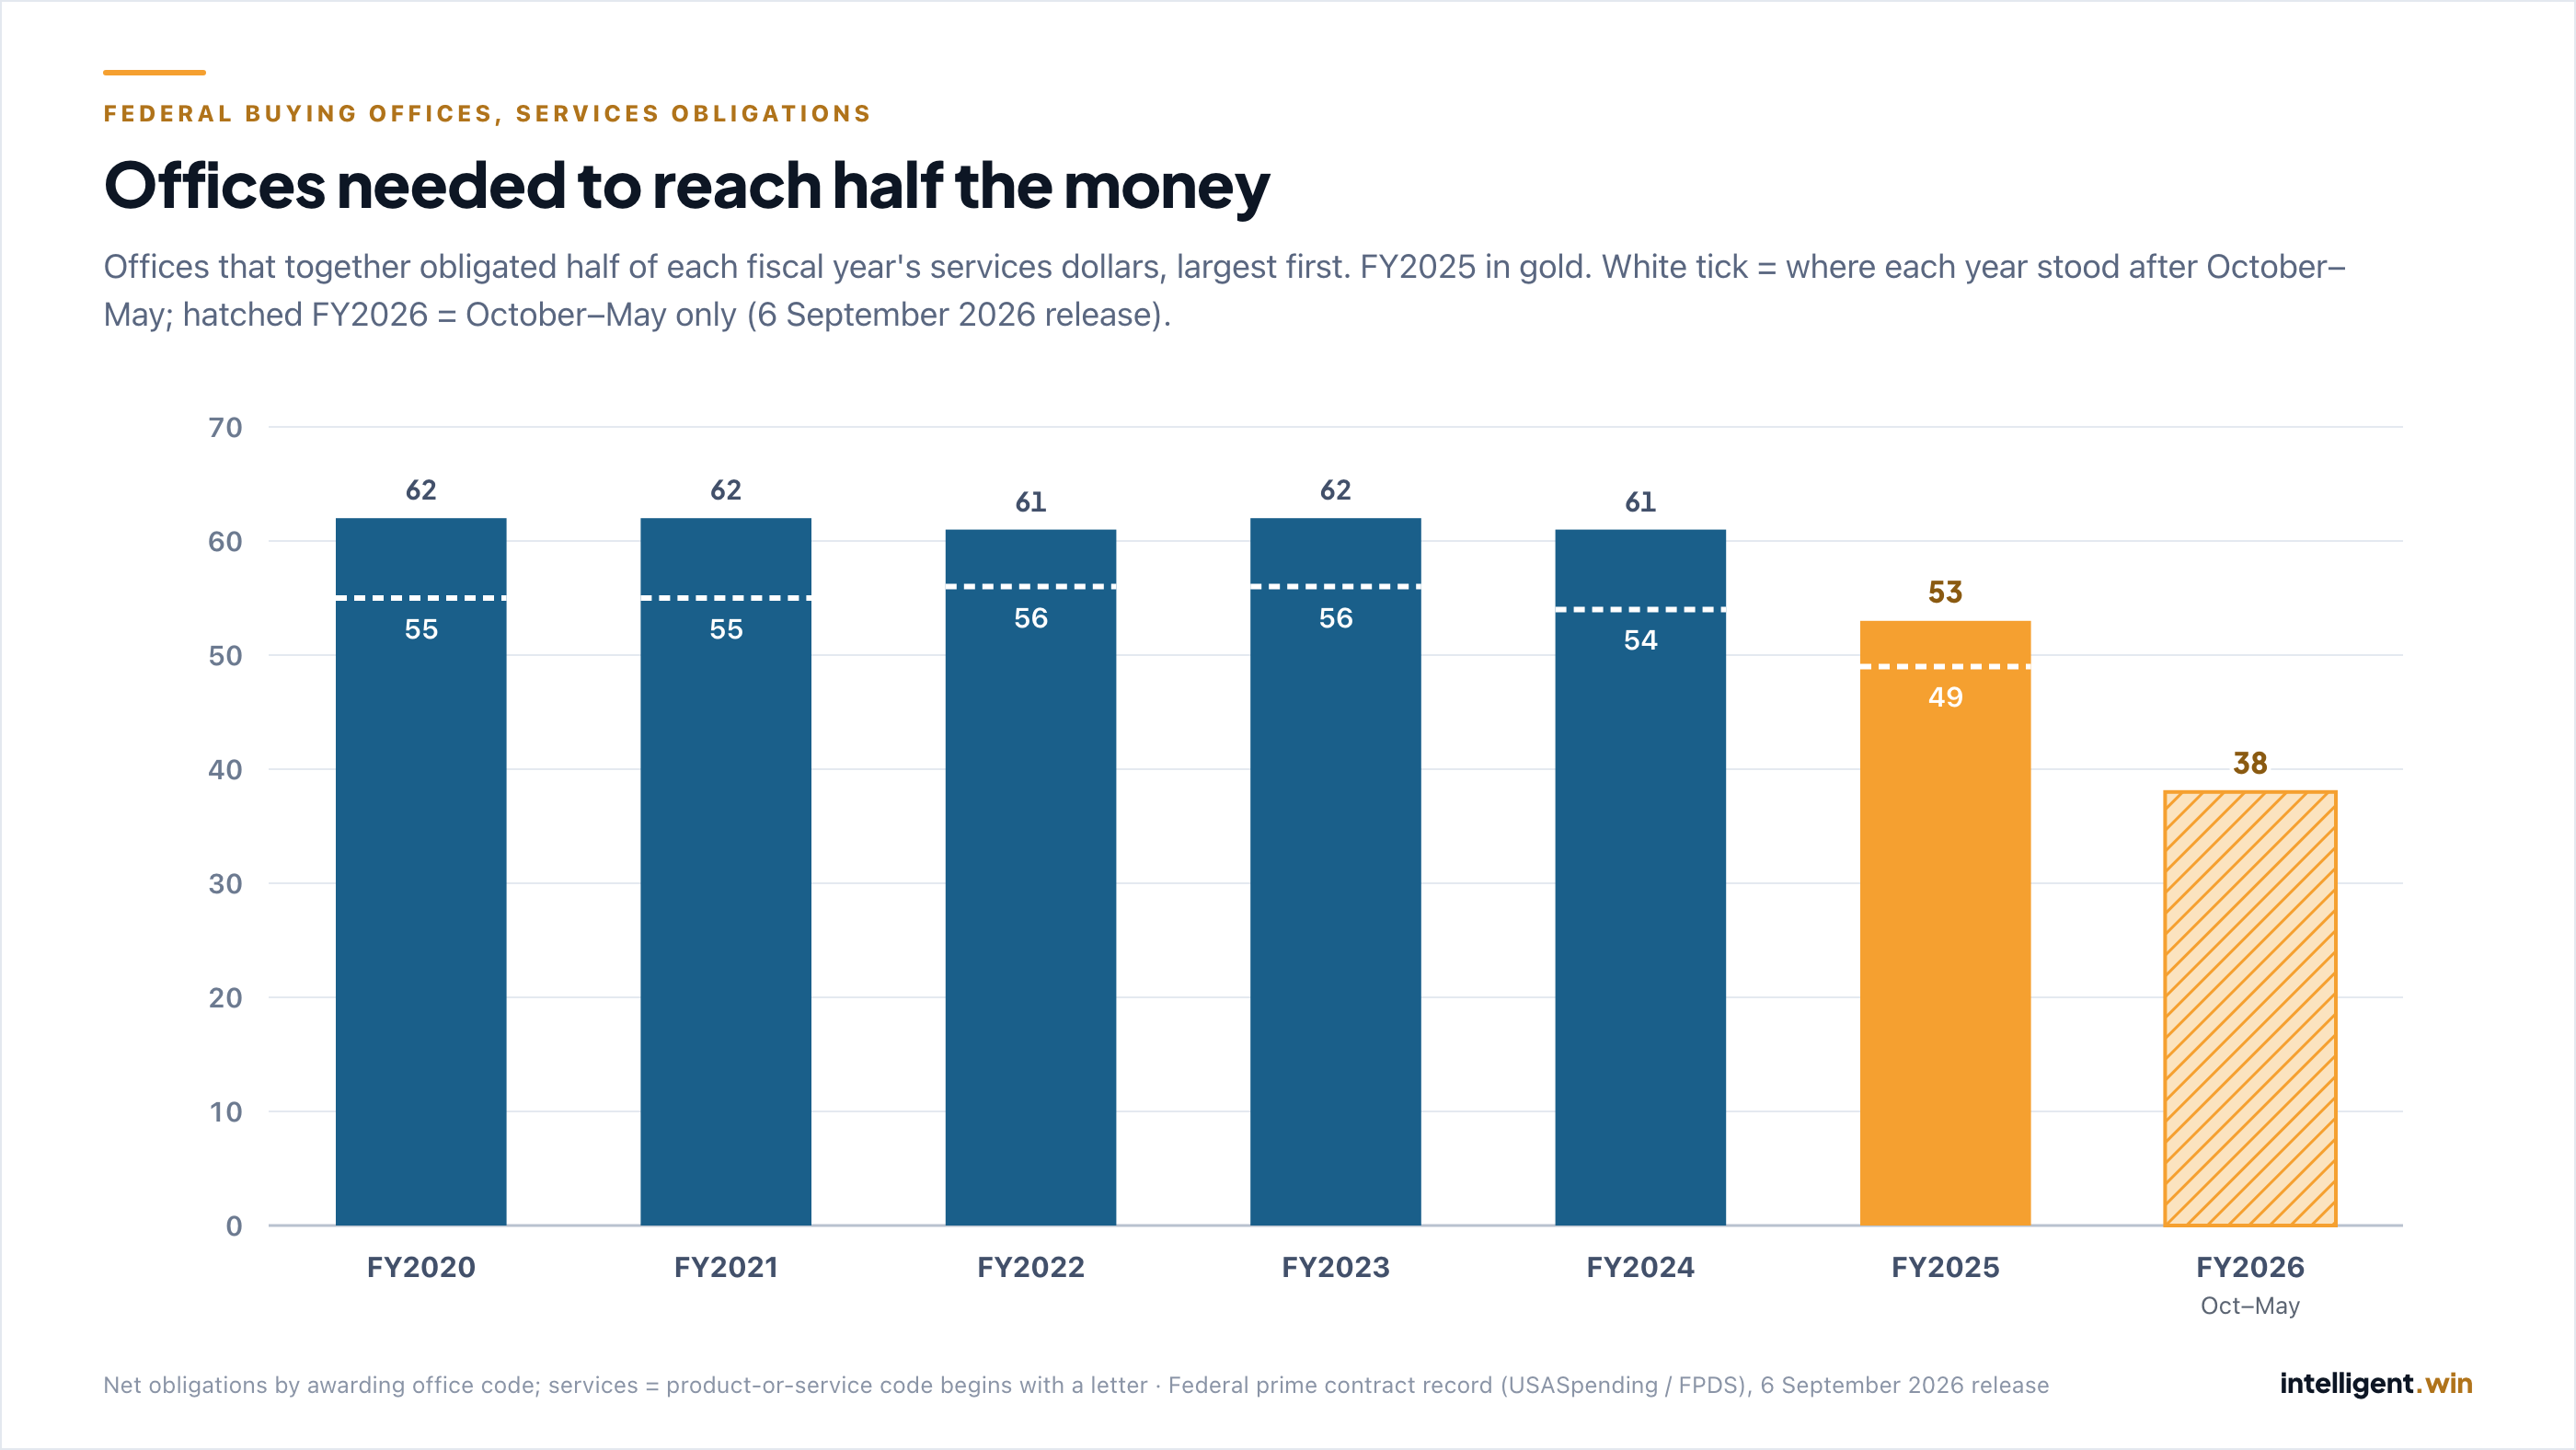
It took 61 or 62 offices to reach half of services dollars in every year from FY2020 to FY2024. In FY2025 it took 53. The civilian count moved the same way, from 19–21 offices to 13.
FY2026 so far: 38 offices
Fiscal 2027 has started, so the natural question is what FY2026 looked like. The record is not complete yet: defense contract records reach the public file about 90 days after they are signed, so the full FY2026 year, defense included, only arrives with the release due in January 2027. What is complete across every agency in the 6 September 2026 release is October through May.
Over those eight months the government obligated $323.7 billion for services through 2,400 buying offices (2,121 of them with positive net obligations), and half of it went through 38 of them. The same eight months of FY2025 took 49 offices to reach half, and FY2020 through FY2024 took 54 to 56. The ten largest offices alone handled 31.3% of October–May services dollars, against 26.7% in the same window a year earlier.
The civilian side drove it. Half of the $167.6 billion civilian agencies obligated for services from October to May went through 9 offices, against 12 a year earlier; on the defense side, half of $156.1 billion went through 40, against 41.
Two cautions. In every year we measured, October–May looks more concentrated than the full year, which is why the chart marks where each prior year stood at the same point rather than comparing 38 to a full-year count. And the defense figure will move as late-filed records land; the civilian figure should move little.
| October–May | Services dollars | Offices with net obligations above zero | Offices to reach half |
|---|---|---|---|
| FY2025 | $268.4B | 2,222 | 49 |
| FY2026 | $323.7B | 2,121 | 38 |
The tightening is civilian — defense took 46 offices every year — and it is not one office. The VA’s community-care buying office in Fredericksburg has grown every year, from $11.53B in FY2020 to $34.15B in FY2025, and is now 7.0% of all federal services dollars by itself. But take it out of every year and the civilian count still falls from 24–26 offices to 20. In FY2025 the 13 largest civilian offices grew by $10.9B while the rest of civilian services spending fell by $18.0B.
The first thing we did was try to break it
- Gross dollars instead of net. Counting only positive obligations (so de-obligations don’t shrink an office): 57 offices reach half.
- Without medical care, facility operations and construction. Excluding those kinds of work — where a few very large contracts sit — 63 offices reach half.
- Without the two largest offices. 71 offices reach half of what is left.
- The office that pays instead of the office that buys. Using the funding office rather than the awarding office: 78.
Every version lands between 53 and 78 offices out of well over 2,000.
What this does and does not say
It says federal services buying runs through a small number of contracting offices, that the pattern has been stable for six years, and that it tightened in FY2025 because the largest civilian offices grew while the rest shrank.
It does not say those offices are where any particular company should compete, or that smaller offices matter less to the firms that win there. It says nothing about competition or who wins at any office.
“Office” here is the office code on each federal transaction. One command can use several codes — two of the ten largest defense codes carry the same Army command name — so the real number of organizations behind half the money is, if anything, smaller.
Each office above has its own page on the platform — who wins there, what it buys and how competitive its work is.
These numbers came out of the platform, not a spreadsheet.
The same contract corpus behind this note — 2.6 million contracts, reconciled against the government’s own published totals before anything publishes — is what the product runs on. If you want to see how it’s assembled and checked, that’s written up in full.